Fig. 7.

Download original image
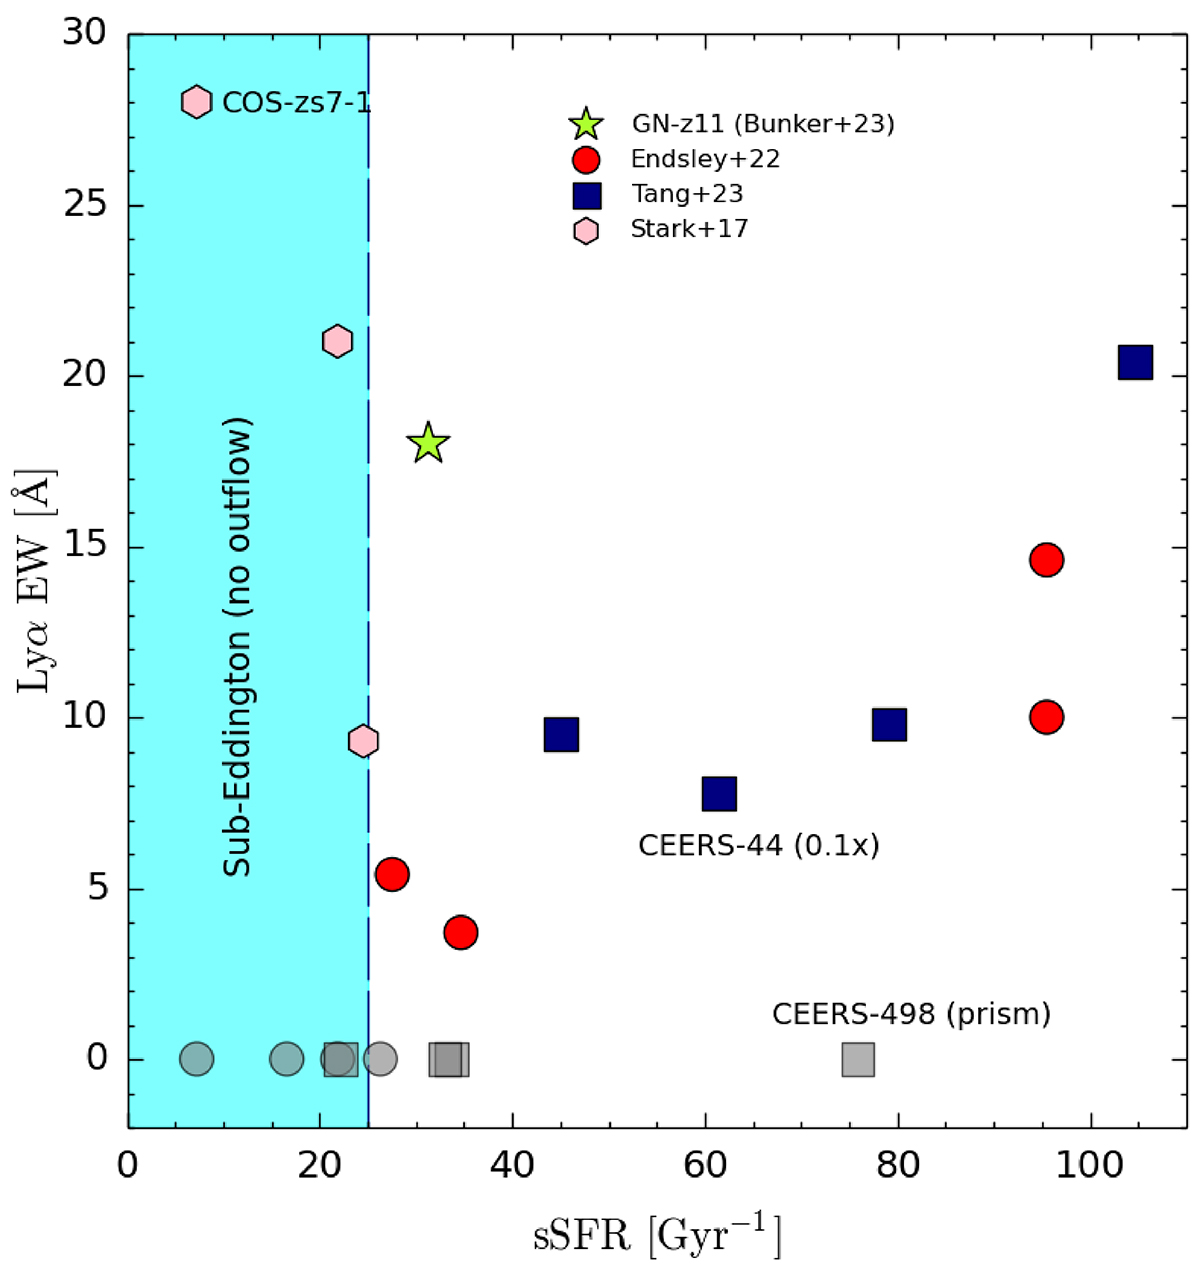
Lyα EW versus sSFR for 20 galaxies at z ≳ 7. The data points are taken from the following samples: Tang et al. (2023, blue squares), Endsley et al. (2022, red circles), Stark et al. (2017, pink hexagons). The gray points in each sample show non-detections. Also shown is GN-z11 (Bunker et al. 2023, green star). The EW of CEERS-44 has been multiplied by 0.1 for display purposes. The cyan band shows the sub-Eddington regime in which sSFR < 25 Gyr−1 (no outflows expected). The two exceptions (CEERS-498 and COS-zs7-1) to our outflow condition are individually marked and discussed in the text.
Current usage metrics show cumulative count of Article Views (full-text article views including HTML views, PDF and ePub downloads, according to the available data) and Abstracts Views on Vision4Press platform.
Data correspond to usage on the plateform after 2015. The current usage metrics is available 48-96 hours after online publication and is updated daily on week days.
Initial download of the metrics may take a while.


