Fig. 6.

Download original image
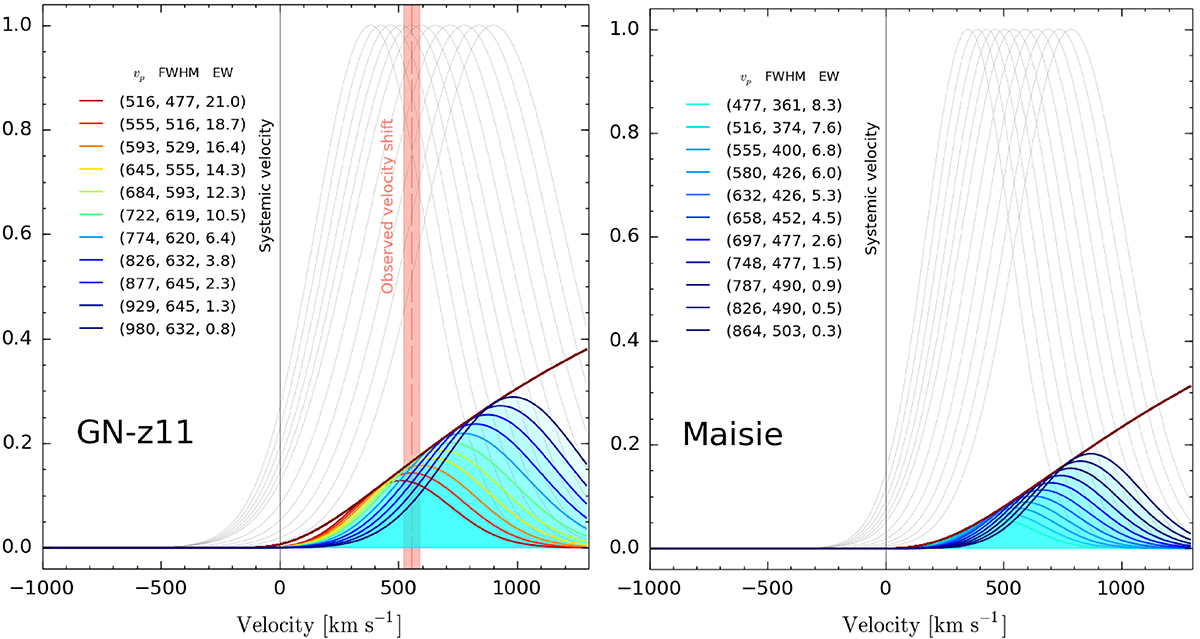
Predicted profiles of the observed Lyα line from two super-Eddington galaxies GN-z11 (Bunker et al. 2023) at z = 10.6 and Maisie (Finkelstein et al. 2022; Arrabal Haro et al. 2023b) at z = 11.4. In each panel, different curves from left to right refer to the ISM neutral hydrogen column densities NHI = 1020 + 0.1j cm−2, with j = 0, 1, …, 10. The gray lines show the Lyα profile emerging from the galaxy, which also accounts for the outflow velocity. The colored lines represent the observed profile after transmission through the IGM, whose GP damping wing, including the surrounding H II bubble (e−τGP), is shown by the red curve. For each observed curve, we show the values of the line peak velocity shift, vp, FWHM (both in [km s−1]), and EW in [Å]. For GN-z11 the observed values (Bunker et al. 2023; Scholtz et al. 2023) are (vp, FWHM, EW) = (555 ± 32 km s−1, 530 ± 65 km s−1, 18 ± 2 Å), which are very well reproduced by the curve with NHI = 1020.1 cm−2. At the same NHI, we predict that the Lyα EW for Maisie is 7.6 Å.
Current usage metrics show cumulative count of Article Views (full-text article views including HTML views, PDF and ePub downloads, according to the available data) and Abstracts Views on Vision4Press platform.
Data correspond to usage on the plateform after 2015. The current usage metrics is available 48-96 hours after online publication and is updated daily on week days.
Initial download of the metrics may take a while.


