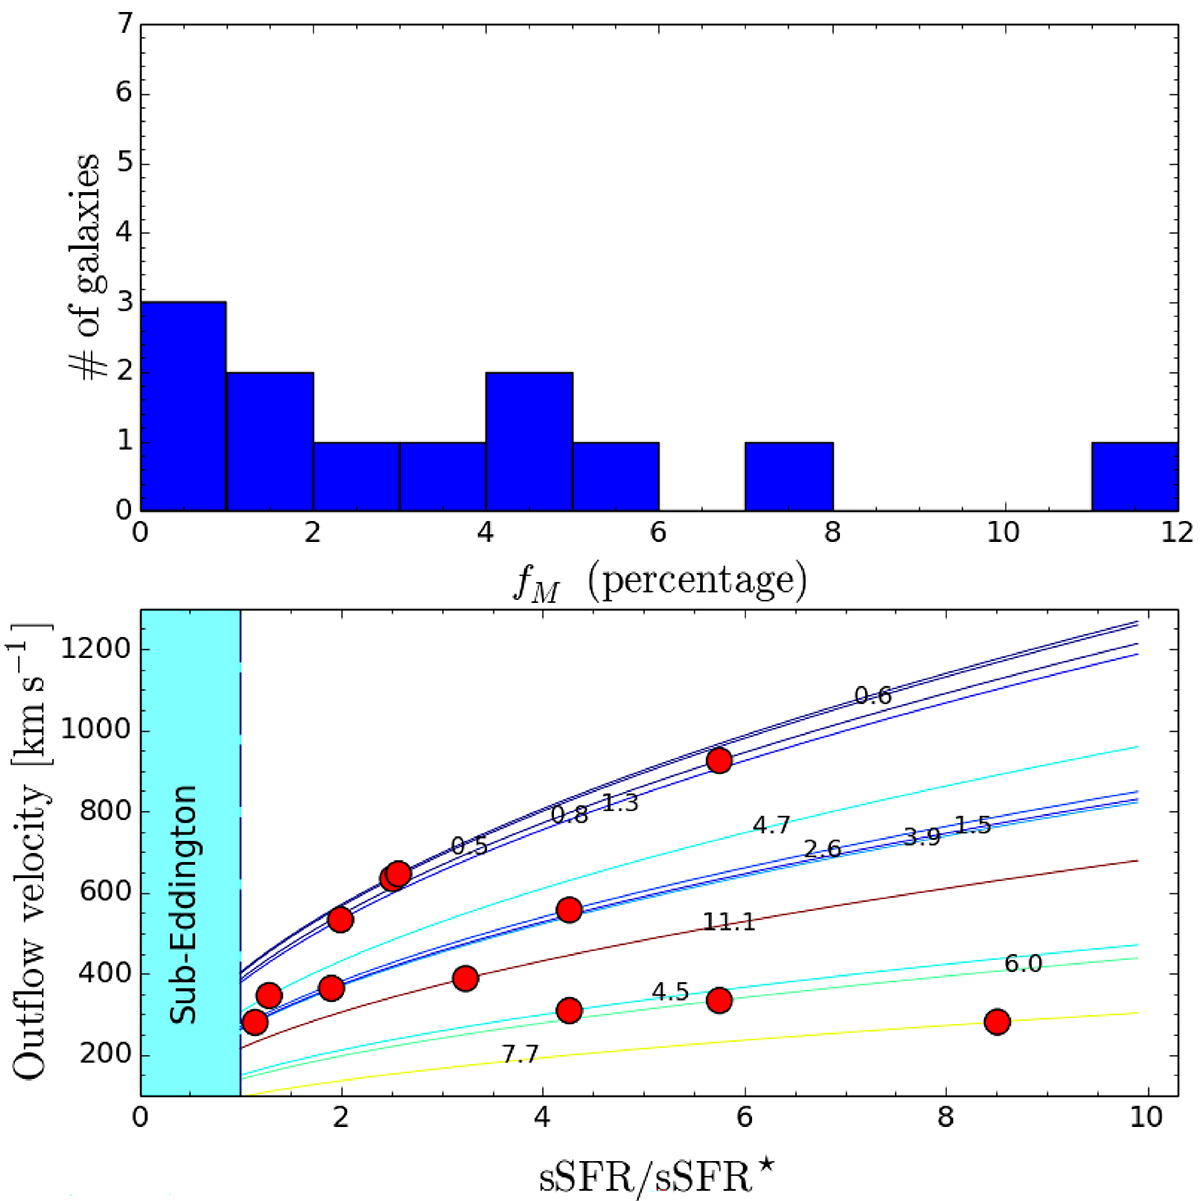
Fig. 5.
Download original image
Model prediction for outflows. Bottom panel: Outflow terminal velocity (Eq. (15), lines) as a function of the sSFR normalized to the critical value sSFR⋆ (Eq. (2)). The galaxies for which sSFR/sSFR⋆ > 1 are in the super-Eddington regime. Also shown (cyan band) is the sub-Eddington region. The predictions are compared to JWST/JADES data (Carniani et al. 2024, red points) for 12 galaxies in 3 < z < 9 with measured outflow velocity. The data are also used to derive the fraction of halo gas entrained by the outflow, fM (see Eq. (15)), whose (percentage) value is shown by the number on each curve. Top panel: Histogram of the fM values derived in the bottom panel.
Current usage metrics show cumulative count of Article Views (full-text article views including HTML views, PDF and ePub downloads, according to the available data) and Abstracts Views on Vision4Press platform.
Data correspond to usage on the plateform after 2015. The current usage metrics is available 48-96 hours after online publication and is updated daily on week days.
Initial download of the metrics may take a while.