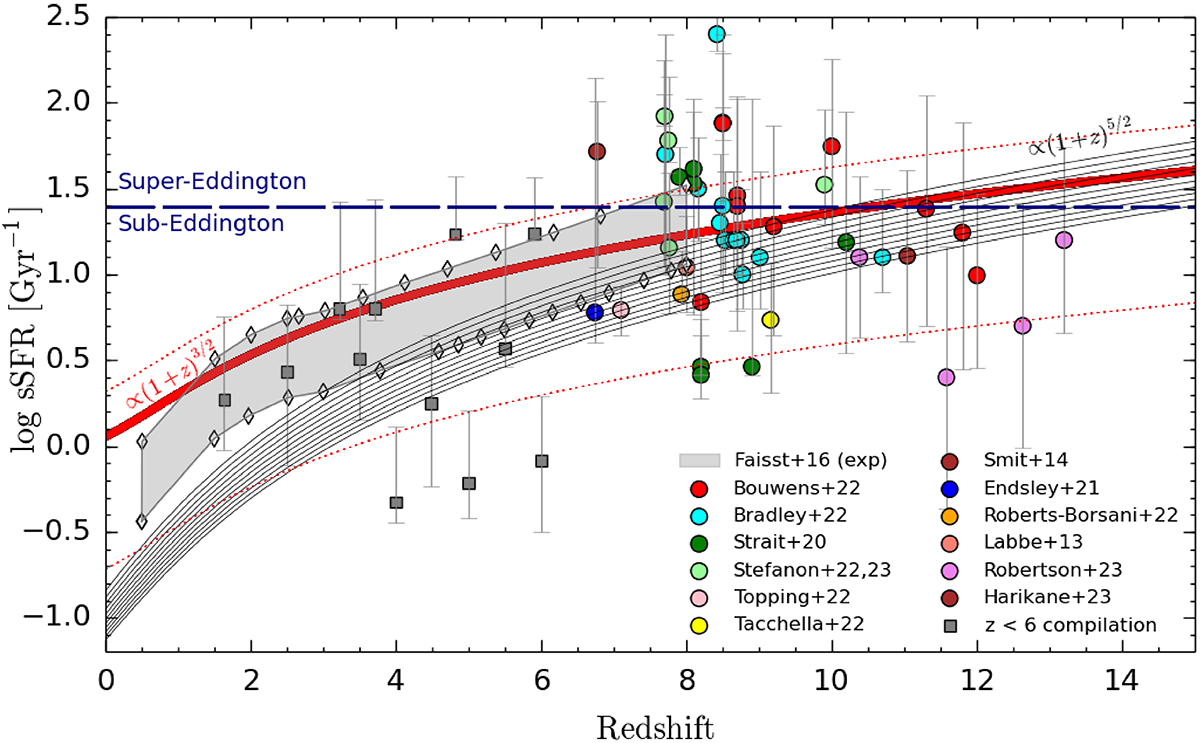
Fig. 2.

Download original image
Redshift evolution of the sSFR for the two models explored here. The red line corresponds to the fiducial model in which most stars formed over the last free-fall time (Eq. (6)) along with ±1σ uncertainties (red dotted) derived from data in 8 < z < 10. Black lines account for halo mass growth (Eq. (8)) and are shown for present-day halo values of log(M0/M⊙) = 10 − 15 (bottom to top) in 0.5 dex intervals; these curves approximately evolve as (1 + z)5/2. Models are compared with available data points for high-z galaxies from (Bouwens et al. 2022a; Bradley et al. 2022; Strait et al. 2020; Stefanon et al. 2022, 2023; Topping et al. 2022; Tacchella et al. 2022; Smit et al. 2014; Endsley et al. 2021; Roberts-Borsani et al. 2022; Labbé et al. 2013; Robertson et al. 2023; Harikane et al. 2023a). The horizontal dashed line is the critical sSFR (Eq. (2)) above which outflows develop.
Current usage metrics show cumulative count of Article Views (full-text article views including HTML views, PDF and ePub downloads, according to the available data) and Abstracts Views on Vision4Press platform.
Data correspond to usage on the plateform after 2015. The current usage metrics is available 48-96 hours after online publication and is updated daily on week days.
Initial download of the metrics may take a while.


