Fig. 1.

Download original image
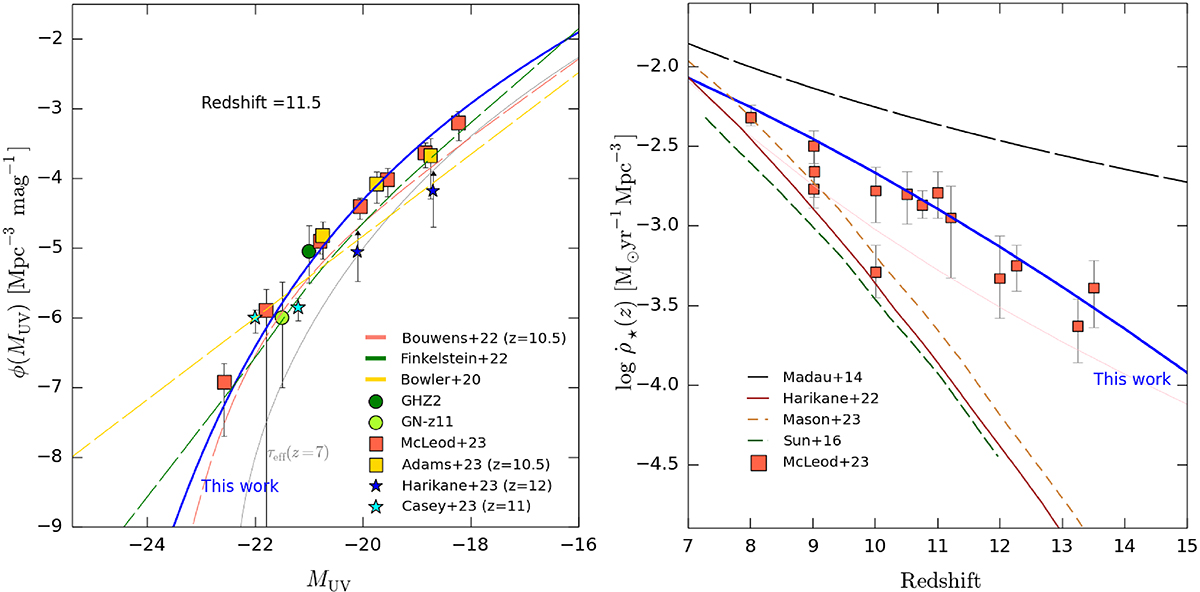
Results of the Ferrara et al. (2023) model used here. Left panel: Predicted UV luminosity function (blue curve) compared with available data at z ≃ 11.5 (points). The blue curve assumes no dust attenuation, while the gray curve marked as τeff(z = 7) assumes that the dust attenuation at z = 11.5 is the one calibrated at z = 7 using the ALMA REBELS data (Bouwens et al. 2022a; Ferrara et al. 2022). The data are from Castellano et al. (2022, GHZ2), Bunker et al. (2023, GN-z11), McLeod et al. (2023), Adams et al. (2023), and Harikane et al. (2023a) lower limits. Also shown are empirical fits provided by Bouwens et al. (2022b, red dashed), Bowler et al. (2020, yellow dashed), and Finkelstein & Bagley (2022, green dashed). Right panel: Predicted evolution of the cosmic SFR density (blue curve), integrated down to a limiting AB mag M1500 = −17, compared with the data compilation of early JWST measurements in McLeod et al. (2023), also including data from Harikane et al. (2023b), Oesch et al. (2018), Donnan et al. (2023a,b), McLeod et al. (2016), Pérez-González et al. (2023). The other lines refer to different model predictions (Madau & Dickinson 2014; Harikane et al. 2022; Mason et al. 2023; Sun & Furlanetto 2016).
Current usage metrics show cumulative count of Article Views (full-text article views including HTML views, PDF and ePub downloads, according to the available data) and Abstracts Views on Vision4Press platform.
Data correspond to usage on the plateform after 2015. The current usage metrics is available 48-96 hours after online publication and is updated daily on week days.
Initial download of the metrics may take a while.


