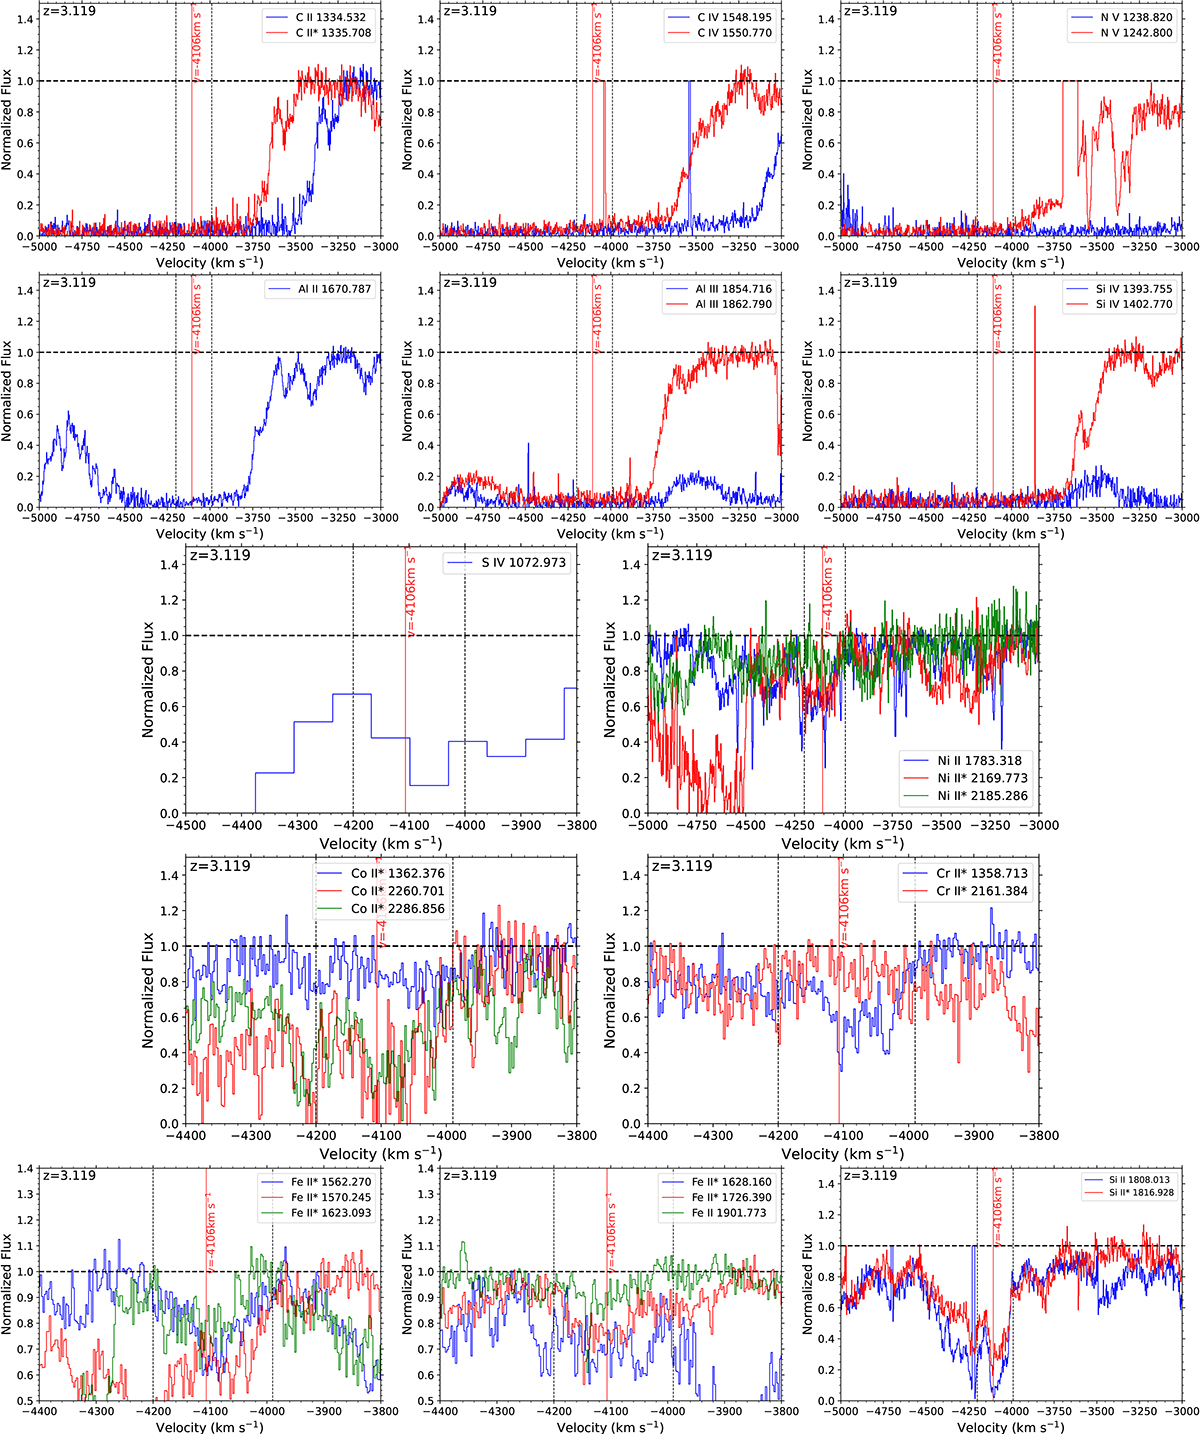
Fig. 3.
Download original image
Normalized spectrum of J1321−0041, converted into velocity space. Troughs of individual ionic transitions are color coded, and the integration ranges used for column density calculations are marked by vertical dotted lines. The continuum is represented by a horizontal dashed line. All spectra shown are UVES spectra, except for that of the S IV absorption, which is based on the SDSS spectra due to wavelength range limitations. We note the stark contrast in the signal-to-noise ratio. The bottom three panels show the Fe II and Si II absorption, which were used to estimate ne.
Current usage metrics show cumulative count of Article Views (full-text article views including HTML views, PDF and ePub downloads, according to the available data) and Abstracts Views on Vision4Press platform.
Data correspond to usage on the plateform after 2015. The current usage metrics is available 48-96 hours after online publication and is updated daily on week days.
Initial download of the metrics may take a while.