Fig. 3.
Download original image
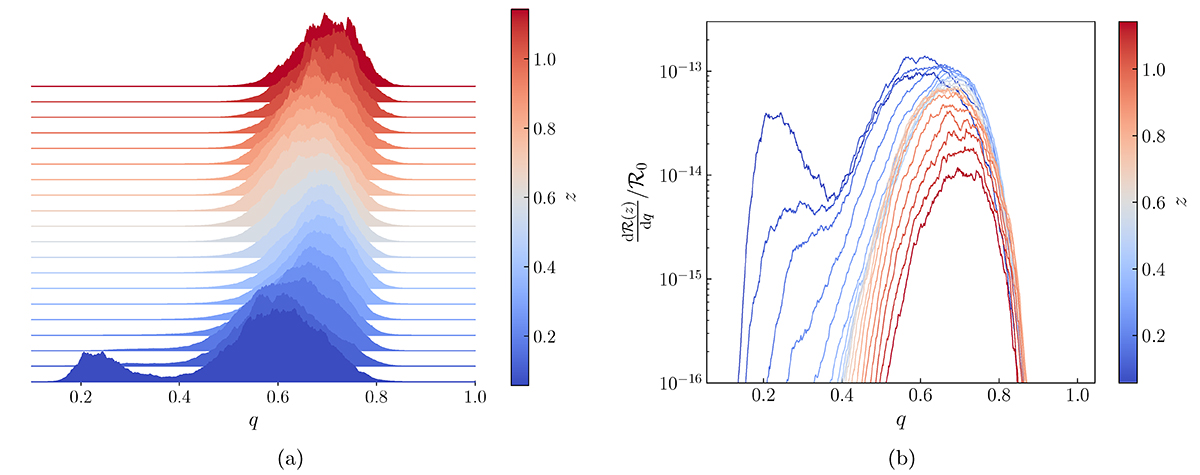
Mass ratio evolution with redshift: joy plot (a) and tomography (b). Both panels report the median distribution only: an animated version of this plot including the 68% credible regions is available online along with plots showing individual slices. This distribution, set aside an excess at low redshifts (z ≲ 0.2), is consistent throughout the whole redshift spectrum in having support at around 0.7, with negligible support for q = 1.
Current usage metrics show cumulative count of Article Views (full-text article views including HTML views, PDF and ePub downloads, according to the available data) and Abstracts Views on Vision4Press platform.
Data correspond to usage on the plateform after 2015. The current usage metrics is available 48-96 hours after online publication and is updated daily on week days.
Initial download of the metrics may take a while.