| Issue |
A&A
Volume 684, April 2024
|
|
|---|---|---|
| Article Number | A71 | |
| Number of page(s) | 8 | |
| Section | Extragalactic astronomy | |
| DOI | https://doi.org/10.1051/0004-6361/202347620 | |
| Published online | 05 April 2024 | |
Disentangling the association of PAH molecules with star formation
Insights from the James Webb Space Telescope and from the UltraViolet Imaging Telescope⋆
1
Department of Physics and Electronics, CHRIST (Deemed to be University), Bangalore 560029, India
e-mail: This email address is being protected from spambots. You need JavaScript enabled to view it.
2
Indian Institute of Astrophysics, Sarjapur Road, Koramangala, Bangalore 560034, India
Received:
1
August
2023
Accepted:
7
January
2024
Abstract
Context. Polycyclic aromatic hydrocarbons (PAHs) are ubiquitous complex molecules in the interstellar medium and are used as an indirect indicator of star formation. On the other hand, the ultraviolet (UV) emission from young massive stars directly traces the star formation activity in a galaxy. The James Webb Space Telescope (JWST), along with the UltraViolet Imaging Telescope (UVIT), opened up a new window of opportunity to better understand the properties of PAH molecules that are associated with star-forming regions.
Aims. We investigate how the resolved scale properties of PAH molecules in nearby galaxies are affected by star formation.
Methods. We analyzed the PAH features observed at 3.3, 7.7, and 11.3 μm using F335M, F770W, and F1130W images obtained from the JWST. These images helped us identify and quantify the PAH molecules. Additionally, we used UVIT images to assess the star formation associated with these PAH-emitting regions. Our study focused on three galaxies, namely NGC 628, NGC 1365, and NGC 7496, which were selected based on the availability of both JWST and UVIT images. Bright PAH emission regions were identified in the JWST images, and their corresponding UV emission was estimated using the UVIT images. We quantified the star formation properties of these PAH emitting regions using the UVIT images. Furthermore, we investigated the relation between the star formation surface density (ΣSFR) and the PAH ratios to better understand the impact of star formation on the properties of PAH molecules.
Results. Based on the resolved scale study of the PAH-bright regions using JWST images, we found that the fraction of ionized PAH molecules is high in the star-forming regions with high ΣSFR. We observed that emission from smaller PAH molecules is higher in star-forming regions with higher ΣSFR.
Conclusions. Our study suggests that the PAH molecules excited by the photons from star-forming regions with higher ΣSFR are dominantly smaller and ionized molecules. UV photons from the star-forming regions could be the reason for the higher fraction of the ionized PAHs. We suggest that the effect of the high temperature in the star-forming regions and the formation of smaller PAH molecules in the star-forming regions might also result in the higher emission in the F335MPAH band.
Key words: ISM: molecules / galaxies: ISM / galaxies: star formation / infrared: galaxies / ultraviolet: galaxies
The reduced UVIT images are available at the CDS via anonymous ftp to cdsarc.cds.unistra.fr (130.79.128.5) or via https://cdsarc.cds.unistra.fr/viz-bin/cat/J/A+A/684/A71
© The Authors 2024
 Open Access article, published by EDP Sciences, under the terms of the Creative Commons Attribution License (https://creativecommons.org/licenses/by/4.0), which permits unrestricted use, distribution, and reproduction in any medium, provided the original work is properly cited.
This article is published in open access under the Subscribe to Open model. This email address is being protected from spambots. You need JavaScript enabled to view it. to support open access publication.
1. Introduction
Polycyclic aromatic hydrocarbon (PAH) molecules play a significant role in the infrared (IR) emission. They contribute up to 20% of the total IR emission in star-forming galaxies. This emission is characterized by a distinctive set of IR bands at 3.3, 6.2, 7.7, 8.6, 11.3, and 12.7 μm, accompanied by weaker IR features (Madden et al. 2006; Smith et al. 2007; Li 2019). The formation of these IR emission features can be attributed to the stochastic heating of PAHs. The stretching modes of C–H bonds give rise to the 3.3, 8.6, and 11.3 μm PAH features, while the C–C bonds contribute to the 6.2 and 7.7 μm features (Allamandola et al. 1989).
There are different theories in place regarding the formation of PAH molecules. The widely accepted formation mechanism proposes carbon-rich asymptotic giant branch (AGB) stars as the cause for the formation of the PAH molecules. AGB stars possess the necessary conditions, such as high collisional rates, cooling flows, shielding, and periodic shocks, to produce significant amounts of precursors (e.g., aliphatic hydrocarbons) to PAHs (Latter 1991). Other formation mechanisms of PAH molecules include the fragmentation of graphitic grains in shocks (Tielens et al. 1987; Jones et al. 1996), accretion of C+ in the diffuse interstellar medium (ISM; Omont 1986; Puget & Leger 1989), gas formation through ion-molecule reactions in dense clouds (Herbst 1991), and the photoprocessing of interstellar dust mantles (Greenberg et al. 2000). However, most of these processes are not properly verified because dedicated observations are lacking.
The specific nature of each of the PAH features helps us to understand the properties of the PAH molecules, such as their size and ionization. The population of larger neutral PAH molecules causes the 11.3 μm emission, while 7.7 μm is the result of vibrational bands of larger positively charged ions (Galliano et al. 2008; Maragkoudakis et al. 2018, 2022; Draine et al. 2021; Rigopoulou et al. 2021). Similarly, most of the emission in the 3.3 μm band is attributed to small neutral PAHs in the range of 50–100 carbon atoms (Ricca et al. 2012; Draine et al. 2021). Ricca et al. (2012) found an inverse relation between the 3.3 μm/11.2 μm band ratio and PAH size, suggesting that the higher the band ratio, the smaller the size of the PAH molecules. Hence, the emission strength ratios of the PAH features can provide insights into the nature of PAH molecules.
The star-forming regions contribute significantly to the strength of the observed PAH emission features at 6.2, 7.7, 8.6, and 11.3 μm. Excitation of PAH molecules due to ultraviolet (UV) photons from the massive young stars is considered the driving force of PAH emission from the star-forming regions (Tielens 2008). This association of PAH emission with the population of massive young stars is the underlying reason for using PAH features as tracers of star formation in the galaxies (e.g. Peeters et al. 2004; Xie & Ho 2019). However, the poor understanding of the nature and the properties of the PAH molecules remains a problem when PAH emission is used as an indicator of star formation activity. In this context, it is important to study the effect of star formation on the properties of the associated PAH molecules. Studies have explored the impact of high-energy photons on the dust particles associated with HII regions that are linked to star formation (e.g. Riener et al. 2018, and references therein). Recent studies using the James Webb Space Telescope (JWST) also explored the properties of PAHs associated with HII regions (e.g. Chastenet et al. 2023). Although the emission observed in the UV range is considered a direct indicator of star formation (Kennicutt 1998), previous studies investigating the connection between star formation and PAH molecules were hindered by the limitations in the spatial resolution of telescopes available for observations in the UV and IR regimes.
The JWST is revolutionizing our current understanding of the early Universe as well as the local Universe, with its unprecedented spatial resolution in the IR regime (e.g. Harikane et al. 2023; Donnan et al. 2023; Finkelstein et al. 2023; Hoyer et al. 2023; Dale et al. 2023). Of the four primary instruments on board the JWST, the Mid-Infrared Instrument (MIRI; Rieke et al. 2015), the Near-Infrared Camera (NIRCam; Rieke et al. 2005), and the Near-infrared Spectrograph (NIRSpec; Jakobsen et al. 2022), cover the IR spectral range where the PAH features are present. The wide range of filters provides an opportunity for us to study the emission in different regions of the mid-IR regime. The coverage of filters, F335M (Δλ ∼ 0.347 μm, FWHM ∼ 0.111″), F770W (Δλ ∼ 1.95 μm, FWHM ∼ 0.269″), and F1130W (Δλ ∼ 0.73 μm, FWHM ∼ 0.375″), of the JWST is designed to detect emission in the PAH features at 3.3, 7.7, and 11.3 μm. As we discussed earlier, these band ratios can be used to understand the nature of the PAH molecules.
Regions undergoing active star formation, characterized by the presence of young, hot, massive, and luminous O, B, A stars on the main sequence, emit a significant amount of UV radiation. As a result, these star-forming regions appear bright in UV images. Therefore, the ultraviolet continuum serves as a clear and direct tracer of recent star formation in galaxies, typically within a time frame of approximately 200 million years (Kennicutt 1998). During the past decade, the UltraViolet Imaging Telescope (UVIT) on board AstroSat opened up a new window of opportunity for high-resolution UV studies of galaxies in the nearby Universe (e.g. George et al. 2018a,b; Mondal et al. 2018; Yadav et al. 2021; Ujjwal et al. 2022; Joseph et al. 2022; Devaraj et al. 2023; Rakhi et al. 2023; Robin et al. 2024). Compared to its predecessor GALEX, UVIT offers a four times better spatial resolution of ∼1.4″. Due to its wide field of view (FOV = 28′), UVIT could provide the complete coverage of most nearby galaxies.
In this study, we intend to associate the PAH band ratios with the star formation properties to decipher how the star formation affects the properties of the PAH molecules. In order to achieve this goal, we analyzed the high-resolution UV and IR images of three galaxies in the nearby Universe from the UVIT and JWST space missions, respectively. A brief description of the sample is given in the Sect. 2. The data inventory is explained in Sect. 3, followed by the analysis and results in Sect. 4. The discussion and summary of the study are presented in Sects. 5 and 6, respectively. A flat Universe cosmology is adopted throughout this paper, with H0 = 71 km s−1 Mpc−1 and ΩM = 0.27 (Komatsu et al. 2011).
2. Sample
To investigate the impact of star formation on the characteristics of PAH molecules, it is essential to analyze high-resolution data in both the UV and IR ranges. Furthermore, to comprehend the relation between star formation and PAH molecules at a resolved scale, the proximity of the galaxies plays a crucial role. Based on the availability of both UVIT and JWST observations, we selected a sample of three nearby galaxies within a distance of 20 Mpc, that is, NGC 628, NGC 1365, and NGC 7496, for this study. The comparable gas-phase metallicity of the sample of galaxies (see Groves et al. 2023) also enabled us to discard the effect of metallicity on the PAH properties. A brief description of the galaxies is provided in the following subsections.
2.1. NGC 628
NGC 628 is an Sc-type galaxy with an inclination of 9°, and it lies at a redshift of z ≈ 0.00219, which corresponds to a distance of 9.8 Mpc (Anand et al. 2021). NGC 628 is the most prominent member of a small group of galaxies. The group is centered on NGC 628 and the peculiar spiral NGC 660. The two well-defined spiral arms observed in optical and UV images make NGC 628 a typical example of grand-design spirals. NGC 628 has not gone through any recent interactions in the past 1 Gyr (Kamphuis & Briggs 1992). Ujjwal et al. (2022) studied the star-forming regions in NGC 628 using UVIT far-ultraviolet (FUV) and near-ultraviolet (NUV) images and explored the secular evolution of NGC 628, which is driven by the spiral arms of the galaxy.
2.2. NGC 1365
NGC 1365 is a member of the Fornax cluster (Lindblad 1999). It is a nearby archetype of a barred spiral SBb(s) Seyfert 1.8 galaxy at an approximate distance of 19.6 Mpc (Anand et al. 2021). Studies by Gao et al. (2021) showed that when compared to the outer regions, NGC 1365 has an increased star formation activity in the inner circumnuclear ring. Alonso-Herrero et al. (2012) reported an intense star formation activity in the inner parts of the galaxy using various IR star formation indicators, such as 6.2 and 11.3 μm PAH emission. They also observed that within the inner ∼5 kpc region of NGC 1365, the contribution of active galactic nuclei (AGN) to the IR emission is about 5%.
2.3. NGC 7496
NGC 7496 is a barred spiral SBb(s) Seyfert 2 galaxy at an estimated distance of 18.7 Mpc (Anand et al. 2021). It is reported to be a member of a group containing nine galaxies (Garcia 1993). The galaxy has a circumnuclear star-forming ring that possesses a high central gas surface density (Sandstrom et al. 2023). The galaxy also has a bar with a length of 1′ (Pence & Blackman 1984) that merges into the two spiral arms of the galaxy. It has a fairly large central bulge and a prominent dust lane along the bar. The nuclear region exhibits emission at 1300 MHz, solely due to the presence of an AGN. Singh et al. (2021) found that the star formation estimates of the central regions of the galaxy exhibit enhanced star formation. They also suggested that the UV flux from AGN might be interpreted as flux from hot stars and hence the star formation.
3. Data inventory
We used the MIRI F770W, F1130W, F2100W, and the NIRCAM F335M filters on board the JWST. The images of the galaxy sample were obtained from the Canadian Astronomy Data Centre as part of the Physics at High Angular resolution in Nearby GalaxieS (PHANGS) archive (PHANGS-JWST Treasury program, PI: J C Lee). The details pertaining to the reduction of JWST images are explained in Lee et al. (2023). The images obtained from the PHANGS-JWST Treasury program have an angular resolution of 0.111″, 0.25″, and 0.36″ for the F335M, F770W, and F1130W bands, respectively (Lee et al. 2023). The filters F770W and F1130W are primarily designed to sample sources with a PAH emission at 7.7 and 11.3 μm, respectively (see Chastenet et al. 2023). In order to extract the PAH features from the F335M imaging, starlight continuum needs to be removed from the observed data. Based on the NIRCam F335M (measuring the main PAH emission feature) along with the F300M and F360M filters, Sandstrom et al. (2023) devised a new method for removing the starlight continuum to obtain the F335MPAH images. We made use of the prescription by Sandstrom et al. (2023) to remove the contamination of starlight from the F335M images as given below,
 (1)
(1)
 (2)
(2)
The coefficients provided by Sandstrom et al. (2023) are A = 0.35 and B = 0.65. The F335MPAH and F335Mcont maps are in units of MJy sr−1.
We used UVIT data of the galaxy sample with NGC 628 (PI: ASK pati), NGC 1365 (PI: C S Stalin) and NGC 7496 (PI: Erik Rosolowsky) obtained from the AstroSat ISSDC archive (Kumar et al. 2012). We made use of F148W (λpeak ∼ 1481 Å, Δλ ∼ 500 Å) images for the study. The level 1 data were reduced using the software CCDLab, version 17 (Postma & Leahy 2017). The VIS images were used to incorporate drift correction. Each image was flat fielded, followed by distortion correction and pattern noise using the calibration files in CCDLab (Girish et al. 2017; Postma & Leahy 2017; Tandon et al. 2017, 2020). Astrometric solutions were also made using CCDLab by making use of the Gaia DR3 detections in the observed field (Postma & Leahy 2020). The resolution of the UVIT FUV images of 1.4″ enabled us to resolve the star-forming regions up to ∼66 pc, 127 pc, and 132 pc in NGC 628, NGC 7496, and NGC 1365, respectively. The details pertaining to the UVIT observations, along with the position and distance information of the galaxy sample, are listed in Table 1. Figure 1 represents the UVIT and JWST images of the galaxy sample. The top panel of Fig. 1 represents the UVIT FUV images, which are marked with the footprints of the JWST observations. JWST color composite images of the sample of galaxies were generated using the F770W, F1130W, and F2100W filters and are shown in the bottom panel of Fig. 1.
Details of the galaxy sample.
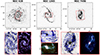 |
Fig. 1. UVIT and JWST images of the sample of galaxies are shown in the top and bottom panels. The field of the JWST observation is marked in the UVIT FUV images. The UVIT footprint with the JWST observation and the corresponding JWST color-composite image of the sample of galaxies are shown in the bottom panel. The JWST color-composite images are generated using the F770W, F1130W, and F2100W filters, which are color-coded in blue, green, and red, respectively. The blue ellipses in the UVIT footprints in the lower panel represent the PAH bright regions identified using ProFound. For all the images, north is up and east is to the left. |
To match the resolution of the images used in this study, the JWST images were convolved to the point spread function (PSF) of the UVIT FUV filter with an FWHM of 13 and 22 pixels for MIRI and NIRCam images, respectively. Of the JWST images of the three sample galaxies, NGC 7496 is the only target with an observed area without any considerable source contamination. We estimated a background value of ∼0.07 MJy sr−1 in the F770W image of NGC 7496. We used this estimate to remove the background from all the MIRI images of our galaxy sample. In the final image, only pixels with a signal-to-noise ratio (S/N) > = 3 were considered for the further analysis. In the case of the NIRCam F335M image, we estimated a background of ∼0.014 MJy sr−1 in the image of NGC 7496. Similar to the MIRI images, we used this background estimate to select the pixels with S/N ≧ 3 in the NIRCam image of all three galaxies. To remove any possible contamination due to the AGN in the galaxies NGC 1365 and NGC 7496, the central 15″ region of the images was masked.
4. Analysis and results
4.1. Tracing the PAH emission using JWST images
UV photons are significantly absorbed by PAH molecules. The excited PAH molecules deexcite through vibrational transitions, resulting in the production of molecular emission features in the IR (Draine & Li 2007). To correlate the properties of the PAH molecules with the corresponding UV emission, it is important to identify the bright regions in the JWST images. Identifying the star-forming regions using UVIT images and then correlating them with the corresponding emission in JWST images limits us to the PAH emission associated with star formation. We identified regions with the brightest PAH emission from JWST images and then estimated the UV emission associated with the same region from the corresponding UVIT images.
To extract the brightest regions from the MIRI 770W images of the sample of galaxies, we used the ProFound package. ProFound is an astronomical data-processing tool available in the programming language R (Robotham et al. 2018). ProFound locates the peak-flux areas in an image and identifies bright emission regions as individual source segments. The total photometry is then estimated using an iterative expansion of the observed segments. We used the subroutine of the same name in ProFound to identify the regions with bright PAH emission in the F770W image. We set the criterion that the identified regions should cover at least 24 pixels. This criterion was selected in order to account for the resolution of the FUV filters. The main emphasis in this approach is to determine the lowest number of pixels necessary to enclose a circle with a diameter that corresponds to the resolution of the FUV filter. The PAH segments identified using the F770W image are overlaid on the F1130W and F335MPAH images, and the corresponding PAH emission is quantified.
4.2. UV emission from the PAH-bright regions
We overlaid the segments obtained for the MIRI F770W images on the UVIT FUV images, and the basic information of the identified regions such as position, flux, and extent were obtained (see Ujjwal et al. 2022). The segments overlaid on the UVIT images are represented in the lower panel of Fig. 1. After dilating to obtain a total flux measurement, the output of the analysis performed with ProFound gives us the number of pixels contained in the identified segments. We made use of the total number of pixels to estimate the area of the identified star-forming regions. Then, the magnitude of each identified region was estimated.
Emission in the UV regime is strongly affected by extinction. In order to estimate the star formation rate (SFR) in the star-forming regions using UV emission, it is mandatory to account for both internal extinction and the line-of-sight extinction in the Milky Way. The FHα/FHβ for the identified star-forming regions was compiled from Santoro et al. (2022). An intrinsic Balmer ratio of 2.86 for case B recombination at an electron temperature Te = 10 000 K and density ne = 100 cm−3 was considered for the internal extinction correction (Osterbrock 1989). Extinction in Hα was estimated as follows:
 (3)
(3)
where KHα = 2.53 and KHβ = 3.61 are the extinction coefficients for the Galactic extinction curve from Cardelli et al. (1989). A(Hα) was then converted into AFUV using the coefficients obtained from Cardelli et al. (1989). The line-of-sight extinction was also accounted for using Cardelli et al. (1989) with the Av values compiled for each galaxy from Schlafly & Finkbeiner (2011). Hereafter, we use the extinction-corrected magnitudes for the further analysis. The SFR in each region was estimated using the relation obtained from Karachentsev & Kaisina (2013) and is given below,
 (4)
(4)
where magFUV denotes the extinction-corrected magnitude, and D is the distance to the galaxy in Mpc. The ProFound package provided the total number of pixels containing 100% of the flux for each of the identified regions. Subsequently, we calculated the area by considering the plate scale of the UVIT images. The star formation surface density (ΣSFR) of the identified regions was determined by dividing the estimated SFR by the corresponding area of each region (in kpc2).
4.3. Band ratios and UV emission
We have discussed how the PAH band ratios can be used to understand the properties of the contributing PAH molecules in Sect. 1. For example, in the region of interest, a higher fraction of ionized PAH is indicated by a higher value of F770W/F1130W. Similarly, the band ratios F335MPAH/F770W and F335MPAH/F1130W can be used to identify the size of the dominant PAH molecules in the region of interest, that is, a higher value of F335MPAH/F770W or F335MPAH/F1130W suggest that smaller neutral PAH molecules are dominant compared to larger PAH molecules (e.g. Micelotta et al. 2010).
To understand how the nature of the PAH molecules is related to the star formation environment of the sample of galaxies, we plot the ΣSFR versus the running median of the band ratios in Fig. 2. In our analysis, we focused on the regions within the 16th to 84th percentile range of the total distribution. This approach helped us to address any potential offset that might arise from the extreme values observed in the JWST bands. The bin selection was made in such a way that the number of data points in each bin remained the same. Figure 2A represents the variation in the running median of the PAH band ratios F335MPAH/F1130W. The band ratios are higher for regions with high ΣSFR for the galaxy sample. Figure 2A also shows an offset between the band ratios of all three galaxies. An increase in the band ratio can be correlated to the decrease in the size of the PAH molecules. The band ratio F335MPAH/F1130W increases in the order NGC 628 < NGC 1365 < NGC 7496. This implies that NGC 7496 hosts the smallest PAH molecules, whereas NGC 628 contains the largest PAH molecules in our galaxies. A similar trend is observed in F335MPAH/F770W (Fig. 2B). The variation in the band ratio F335MPAH/F770W is relatively smaller in NGC 7496 than in NGC 628 and NGC 1365.
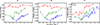 |
Fig. 2. Variation in the running median of the band ratios corresponding to the ΣSFR. Panels A, B, and C represent the band ratios F335MPAH/F1130W, F335MPAH/F770W, and F770W/F1130W, respectively. The blue cross, green hexagon, and red plus represent the galaxies NGC 628, NGC1365, and NGC 7496, respectively. The associated standard mean error is also represented. |
Figure 2C shows that the ratio F770W/F1130W increases with an increase in the ΣSFR. This in turn suggests that the fraction of ionized PAH molecules is higher in star-forming regions with higher ΣSFR. The high-energy UV photons from the star-forming regions could be the reason for the observed high ionization in the region. We also observe a shift in the estimates of the band ratios between the galaxies. This suggests that NGC 628 hosts more neutral PAH molecules, whereas NGC 7496 contains the least number of neutral PAH molecules. This finding can be linked to the previous result, which indicated a weaker variability in the F335MPAH/F770W ratio for NGC 7496. One possible explanation for this observation might be the influence of an active nucleus within the galaxy (e.g., García-Bernete et al. 2022b).
The results from the Fig. 2 suggest a difference in the population of PAH molecules with respect to the ΣSFR of the associated star-forming regions. To investigate the influence of the star-forming environment on the properties of PAH molecules, we divided the star-forming regions within the galaxy sample into two categories: high star-forming (HSF) regions and low star-forming (LSF) regions. This categorization was based on the median ΣSFR observed in the star-forming regions of each galaxy. Star-forming regions with ΣSFR values lower than the median ΣSFR of the respective galaxy were classified as LSF regions, while regions with equal or higher ΣSFR values were considered HSF regions. The median ΣSFR values for NGC 628, NGC 1365, and NGC 7496 were found to be 0.011, 0.005, and 0.004 M⊙ yr−1 kpc−2, respectively.
The first two panels of Fig. 3 depict the kernel distribution estimation (KDE) of the band ratios F335MPAH/F1130W, and F335MPAH/F770W for star-forming regions classified as HSF and LSF within the galaxy sample. Figure 3 clearly shows that the band ratios F335MPAH/F1130W and F335MPAH/F770W exhibit higher values in star-forming regions belonging to the HSF than those belonging to the LSF, suggesting that the smaller PAH molecules are dominant in the star-forming regions with higher ΣSFR. In this analysis, the F335MPAH/F770W ratio of NGC 7496 also deviates from the general trend. As we discussed earlier, the higher fraction of the ionized PAH molecules might be the reason for this deviation. In order to verify whether the band ratios of PAH-bright regions belonging to HSF and LSF are constituted by two different populations of PAH molecules, we performed a two-sample Kolmogorov-Smirnov test (K-S test) on the properties of the star-forming regions. The probability predicted by the K-S test for the band ratios F335MPAH/F1130W and F335MPAH/F770W of all three sample of galaxies are < 10% and < 10−1%, respectively. These results suggest that the population of PAH molecules linked to star-forming regions with higher ΣSFR differs from the population associated with lower ΣSFR. This might be interpreted to mean that the size of the PAH molecules is different in high and low star-forming environments.
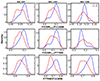 |
Fig. 3. KDE plot representing the band ratios in the galaxy sample with respect to the ΣSFR. The PAH bright regions are classified into high star-forming and low star-forming regions, based on the ΣSFR of the associated star-forming regions. Blue represents the regions with high ΣSFR, and red represents the regions with low ΣSFR. |
The lower panel of Fig. 3 represents the KDE of the band ratio F770W/F1130W. The star-forming regions with higher ΣSFR exhibit higher values for F770W/F1130W in all three galaxies than in the regions with lower ΣSFR. In order to verify whether the band ratios of PAH-bright regions belonging to HSF and LSF are constituted by two different populations of PAH molecules, we performed a two-sample K-S test on the properties of the star-forming regions. For all three galaxies, the K-S test performed on the F770W/F1130W band ratio of the HSF and LSF resulted in a probability of < 10−1%. This in turn suggests that the population associated with star-forming regions with high ΣSFR is different from the population associated with star-forming regions with relatively lower ΣSFR. The difference in the fraction of ionized molecules might be the reason for the observed difference.
5. Discussion
We analyzed the impact of star formation on the resolved scale properties of PAH molecules in a selected sample of three nearby galaxies. Specifically, we investigated how the star formation influences the properties of PAH molecules that are spatially associated with the regions undergoing active star formation. Based on the availability of both JWST and UVIT images, a sample of three nearby galaxies, NGC 628, NGC 1365, and NGC 7496, was selected for the study. Even though the JWST images offer a higher resolution than the UVIT images, the JWST images were degraded to the resolution of the UVIT images for the analysis. PAH-bright regions were identified from the JWST images, and the corresponding star formation rate was estimated using the UVIT images. We examined the correlation between the ΣSFR and the PAH band ratios to gain insight into the influence of the star formation on the ionization and the size of PAH molecules.
Even though the F770W and the F1130W bands predominantly trace the 7.7 and 11.3 μm PAH emission, it is important to acknowledge the potential presence of additional contributions arising from hot dust and/or continuum emission. Using a galaxy sample extracted from the SINGS survey, Whitcomb et al. (in prep.) employed the PAHFIT method (Smith et al. 2007) to extract the contribution of hot dust and/or continuum emission originating from star-forming regions to the spectral bands of JWST. They found that approximately 80% of the F770W emissions is predominantly attributed to PAHs, while roughly 70% of the emission observed in F1130W is due to PAH molecules. This result agrees with emission-line measurements of García-Bernete et al. (2022a), who employed PAHFIT to analyze the Spitzer/IRS spectra for NGC 1365 and NGC 7496. In the context of JWST data, more robust estimates on the contamination will be the subject of future studies. To assess the potential impact of contamination on our findings, we considered potential contamination rates of 20% and 30%, attributed to the dust continuum and to the line emission fraction in the F770W and F1130W filters, respectively. We found that even though the specific values of flux ratios vary, the observed trend in the corresponding PAH band ratios remains unaltered by contamination.
Furthermore, beyond the issue of continuum contamination, silicate absorption at 9.7 μm might affect the F1130W flux. Smith et al. (2007) suggested that this absorption phenomenon is likely to exert only a limited influence on the majority of star-forming galaxies. Furthermore, recent findings by Groves et al. (2023) indicate that H II regions in the sample of galaxies used in this study are characterized by a median E(B − V) value in the range of 0.2–0.3. This signifies a relatively low level of dust attenuation. Hence, we suggest that the silicate absorption feature probably does not significantly affect the results presented in this study. However, more extensive imaging and spectral studies are required to estimate the effect of the 9.7 silicate absorption feature contributing to the filter F1130W.
Chastenet et al. (2023) studied the PAH molecules in the HII regions using PHANGS-JWST images for the sample galaxies in our study. They found that the areas with harder radiation fields near HII regions had a higher proportion of smaller PAH molecules, based on the ratios of F335MPAH/F1130W and F335MPAH/F770W. The results from our study also suggest that the smaller PAH molecules are dominant in star-forming regions with high ΣSFR. However, the apparent increase in the proportion of smaller PAHs within harsh environments contradicts the theoretical understanding that the smaller PAHs typically have shorter lifespans in the hot-gas environment (e.g. Micelotta et al. 2010). While we considered the PAH band ratios, the effect of temperature was not taken into account. An increase in the band ratio can also be due to the decrease in the size of the PAHs or to an increase in the temperature of the region. In this context, it is important to discuss the temperature in our regions of interest in this analysis. In star-forming regions with higher ΣSFR, the PAH molecules may be hotter due to the increase in the average energy of the photons. This increase in temperature might result in a higher emission at lower wavelengths, such as 3.3 μm (e.g. Draine et al. 2021). We cannot confirm that the temperature is a possible factor for the observed higher fraction of smaller PAH molecules in the harsh environments, however. To account for the drawbacks of PAH formation, Jones et al. (1996) proposed a mechanism for the formation of PAHs involving grain–grain collisions and shattering. This concept, also discussed by Guillet et al. (2011), suggests that in interstellar shocks, large grains undergo fragmentation, leading to the generation of numerous small grains through the shattering process. The formation of smaller PAH molecules through fragmentation can also be a possible reason for the observed higher fraction of smaller PAH molecules in regions with high ΣSFR. The enhanced detection of smaller PAH molecules supports the observations by Maragkoudakis et al. (2023) that the smaller PAHs have a stronger impact on the PAH band strengths.
In this context, we have to keep in mind that PAHs might be affected by different factors. Metallicity is one such factor (e.g., Draine et al. 2007). Metal-poor galaxies tend to show very weak or no PAH features in their IR spectra (e.g. Wu et al. 2006; Hao et al. 2009). Groves et al. (2023) estimated the metallicity (12+log(O/H)) for the PHANGS sample of galaxies based on an S-calibration. For NGC 628, NGC 1365, and NGC 7496, they reporteded 12+log(O/H) values of 8.478, 8.477, and 8.507, respectively. Hence, metallicity might not be playing a significant role in the results presented in this study. The presence of an AGN is yet another factor that might influence the existence of PAH molecules. Two of the three galaxies used in this study host AGNs. It therefore needs to be noted that the UV and soft X-ray photons in the strident environment around AGNs could destroy PAHs (Voit 1992; Siebenmorgen et al. 2004). Studies also found PAH emission in the close proximity of AGNs within ≲10 pc of the nucleus (Esquej et al. 2014; Jensen et al. 2017). This suggests that PAHs might survive in the near vicinity of AGNs and might be excited by the photons emitted by them.
This study connects the high-resolution JWST images with the high-resolution UV images of the nearby galaxies. In this study, we were unable to make use of the full resolution capabilities of the JWST because we used UVIT images for the comparison. The unprecedented resolution provided by the JWST and UVIT enabled us to understand the effect of star formation in the properties of the associated PAH molecules, however. Future works needs to be made to decipher how the PAH band ratios are interconnected with the properties of the stellar population such as age and metallicity. More studies need to be conducted to determine the role of the age and metallicity of the stellar population to address the abundance of PAH molecules in galaxies.
6. Summary
A summary of the main results obtained from our study is given below.
-
Based on the availability of JWST and UVIT images, we selected the galaxies NGC 628, NGC 1365, and NGC 7496 to study the effect of star formation with the associated PAH emission.
-
Bright PAH emission regions were identified using the JWST F770W images, and the corresponding UV emission was quantified using UVIT FUV images.
-
Based on the correlation between ΣSFR and the corresponding PAH band ratios, we found that the fraction of ionized PAH molecules is higher in star-forming regions with a high ΣSFR than in those with a lower ΣSFR.
-
In star-forming regions with a higher ΣSFR, we observed increased emission from smaller PAH molecules. This might be influenced by the higher temperatures within star-forming regions or by the formation of smaller PAH molecules.
Acknowledgments
We thank the anonymous referee for the valuable comments that improved the scientific content of the paper. U.K. acknowledges the help and support from Adam Leroy and Erik Rosolowsky for their time and effort for sharing the PHANGS JWST images used in this study. The authors thank Koshy George, Savithri H Ezhikode, Ashish Devaraj and Arun Roy for their suggestions throughout the course of this work. U.K. acknowledges the Department of Science and Technology (DST) for the INSPIRE FELLOWSHIP (IF180855). S.S.K. and A.K.R. acknowledge the financial support from CHRIST (Deemed to be University, Bangalore) through the SEED money project (No: SMSS-2220, 12/2022). S.S.K. and R.T. acknowledge the financial support from Indian Space Research Organisation (ISRO) under the AstroSat archival data utilization program (No. DS-2B-13013(2)/6/2019). This publication uses the data from the UVIT, which is part of the AstroSat mission of the ISRO, archived at the Indian Space Science Data Centre (ISSDC). We gratefully thank all the individuals involved in the various teams for providing their support to the project from the early stages of the design to launch and observations with it in the orbit. This research has used the NASA/IPAC Extragalactic Database (NED), funded by the National Aeronautics and Space Administration and operated by the California Institute of Technology. We thank the Center for Research, CHRIST (Deemed to be university) for all their support during the course of this work.
References
- Allamandola, L. J., Tielens, A. G. G. M., & Barker, J. R. 1989, ApJS, 71, 733 [Google Scholar]
- Alonso-Herrero, A., Sánchez-Portal, M., Ramos Almeida, C., et al. 2012, MNRAS, 425, 311 [CrossRef] [Google Scholar]
- Anand, G. S., Lee, J. C., Van Dyk, S. D., et al. 2021, MNRAS, 501, 3621 [Google Scholar]
- Cardelli, J. A., Clayton, G. C., & Mathis, J. S. 1989, ApJ, 345, 245 [Google Scholar]
- Chastenet, J., Sutter, J., Sandstrom, K., et al. 2023, ApJ, 944, L12 [NASA ADS] [CrossRef] [Google Scholar]
- Dale, D. A., Boquien, M., Barnes, A. T., et al. 2023, ApJ, 944, L23 [NASA ADS] [CrossRef] [Google Scholar]
- Devaraj, A., Joseph, P., Stalin, C. S., Tandon, S. N., & Ghosh, S. K. 2023, ApJ, 946, 65 [NASA ADS] [CrossRef] [Google Scholar]
- Donnan, C. T., McLeod, D. J., Dunlop, J. S., et al. 2023, MNRAS, 518, 6011 [Google Scholar]
- Draine, B. T., & Li, A. 2007, ApJ, 657, 810 [CrossRef] [Google Scholar]
- Draine, B. T., Dale, D. A., Bendo, G., et al. 2007, ApJ, 663, 866 [NASA ADS] [CrossRef] [Google Scholar]
- Draine, B. T., Li, A., Hensley, B. S., et al. 2021, ApJ, 917, 3 [CrossRef] [Google Scholar]
- Esquej, P., Alonso-Herrero, A., González-Martín, O., et al. 2014, ApJ, 780, 86 [Google Scholar]
- Finkelstein, S. L., Bagley, M. B., Ferguson, H. C., et al. 2023, ApJ, 946, L13 [NASA ADS] [CrossRef] [Google Scholar]
- Galliano, F., Madden, S. C., Tielens, A. G. G. M., Peeters, E., & Jones, A. P. 2008, ApJ, 679, 310 [Google Scholar]
- Gao, Y., Egusa, F., Liu, G., et al. 2021, ApJ, 913, 139 [NASA ADS] [CrossRef] [Google Scholar]
- Garcia, A. M. 1993, A&AS, 100, 47 [NASA ADS] [Google Scholar]
- García-Bernete, I., Rigopoulou, D., Alonso-Herrero, A., et al. 2022a, A&A, 666, L5 [NASA ADS] [CrossRef] [EDP Sciences] [Google Scholar]
- García-Bernete, I., Rigopoulou, D., Alonso-Herrero, A., et al. 2022b, MNRAS, 509, 4256 [Google Scholar]
- George, K., Joseph, P., Côté, P., et al. 2018a, A&A, 614, A130 [NASA ADS] [CrossRef] [EDP Sciences] [Google Scholar]
- George, K., Poggianti, B. M., Gullieuszik, M., et al. 2018b, MNRAS, 479, 4126 [Google Scholar]
- Girish, V., Tandon, S. N., Sriram, S., Kumar, A., & Postma, J. 2017, Exp. Astron., 43, 59 [NASA ADS] [CrossRef] [Google Scholar]
- Greenberg, J. M., Gillette, J. S., Muñoz Caro, G. M., et al. 2000, ApJ, 531, L71 [NASA ADS] [CrossRef] [Google Scholar]
- Groves, B., Kreckel, K., Santoro, F., et al. 2023, MNRAS, 520, 4902 [Google Scholar]
- Guillet, V., Pineau Des Forêts, G., & Jones, A. P. 2011, A&A, 527, A123 [NASA ADS] [CrossRef] [EDP Sciences] [Google Scholar]
- Hao, L., Wu, Y., Charmandaris, V., et al. 2009, ApJ, 704, 1159 [NASA ADS] [CrossRef] [Google Scholar]
- Harikane, Y., Ouchi, M., Oguri, M., et al. 2023, ApJS, 265, 5 [NASA ADS] [CrossRef] [Google Scholar]
- Herbst, E. 1991, ApJ, 366, 133 [NASA ADS] [CrossRef] [Google Scholar]
- Hoyer, N., Pinna, F., Kamlah, A. W. H., et al. 2023, ApJ, 944, L25 [NASA ADS] [CrossRef] [Google Scholar]
- Jakobsen, P., Ferruit, P., Alves de Oliveira, C., et al. 2022, A&A, 661, A80 [NASA ADS] [CrossRef] [EDP Sciences] [Google Scholar]
- Jensen, J. J., Hönig, S. F., Rakshit, S., et al. 2017, MNRAS, 470, 3071 [NASA ADS] [CrossRef] [Google Scholar]
- Jones, A. P., Tielens, A. G. G. M., & Hollenbach, D. J. 1996, ApJ, 469, 740 [Google Scholar]
- Joseph, P., Sreekumar, P., Stalin, C. S., et al. 2022, MNRAS, 516, 2300 [NASA ADS] [CrossRef] [Google Scholar]
- Kamphuis, J., & Briggs, F. 1992, A&A, 253, 335 [NASA ADS] [Google Scholar]
- Karachentsev, I. D., & Kaisina, E. I. 2013, AJ, 146, 46 [NASA ADS] [CrossRef] [Google Scholar]
- Kennicutt, R. C., Jr. 1998, ARA&A, 36, 189 [Google Scholar]
- Komatsu, E., Smith, K. M., Dunkley, J., et al. 2011, ApJS, 192, 18 [Google Scholar]
- Kumar, A., Ghosh, S. K., Hutchings, J., et al. 2012, in Ultra Violet Imaging Telescope (UVIT) on ASTROSAT, SPIE Conf. Ser., 8443, 84431N [Google Scholar]
- Latter, W. B. 1991, ApJ, 377, 187 [CrossRef] [Google Scholar]
- Lee, J. C., Sandstrom, K. M., Leroy, A. K., et al. 2023, ApJ, 944, L17 [NASA ADS] [CrossRef] [Google Scholar]
- Li, A. 2020, Nat. Astron., 4, 339 [CrossRef] [Google Scholar]
- Lindblad, P. O. 1999, A&A Rev., 9, 221 [NASA ADS] [CrossRef] [Google Scholar]
- Madden, S. C., Galliano, F., Jones, A. P., & Sauvage, M. 2006, A&A, 446, 877 [NASA ADS] [CrossRef] [EDP Sciences] [Google Scholar]
- Maragkoudakis, A., Ivkovich, N., Peeters, E., et al. 2018, MNRAS, 481, 5370 [CrossRef] [Google Scholar]
- Maragkoudakis, A., Boersma, C., Temi, P., Bregman, J. D., & Allamandola, L. J. 2022, ApJ, 931, 38 [CrossRef] [Google Scholar]
- Maragkoudakis, A., Peeters, E., & Ricca, A. 2023, MNRAS, 520, 5354 [NASA ADS] [CrossRef] [Google Scholar]
- Micelotta, E. R., Jones, A. P., & Tielens, A. G. G. M. 2010, A&A, 510, A37 [NASA ADS] [CrossRef] [EDP Sciences] [Google Scholar]
- Mondal, C., Subramaniam, A., & George, K. 2018, AJ, 156, 109 [NASA ADS] [CrossRef] [Google Scholar]
- Omont, A. 1986, A&A, 164, 159 [NASA ADS] [Google Scholar]
- Osterbrock, D. E. 1989, Astrophysics of Gaseous Nebulae and Active Galactic Nuclei (University Science Books) [Google Scholar]
- Peeters, E., Spoon, H. W. W., & Tielens, A. G. G. M. 2004, ApJ, 613, 986 [NASA ADS] [CrossRef] [Google Scholar]
- Pence, W. D., & Blackman, C. P. 1984, MNRAS, 210, 547 [NASA ADS] [CrossRef] [Google Scholar]
- Postma, J. E., & Leahy, D. 2017, PASP, 129, 115002 [Google Scholar]
- Postma, J. E., & Leahy, D. 2020, PASP, 132, 054503 [Google Scholar]
- Puget, J. L., & Leger, A. 1989, ARA&A, 27, 161 [NASA ADS] [CrossRef] [Google Scholar]
- Rakhi, R., Santhosh, G., Joseph, P., et al. 2023, MNRAS, 522, 1196 [NASA ADS] [CrossRef] [Google Scholar]
- Ricca, A., Bauschlicher, C. W. Jr., Boersma, C., Tielens, A. G. G. M., & Allamandola, L. J. 2012, ApJ, 754, 75 [NASA ADS] [CrossRef] [Google Scholar]
- Rieke, M. J., Kelly, D., & Horner, S. 2005, in Cryogenic Optical Systems and Instruments XI, eds. J. B. Heaney, & L. G. Burriesci, SPIE Conf. Ser., 5904, 1 [NASA ADS] [Google Scholar]
- Rieke, G. H., Wright, G. S., Böker, T., et al. 2015, PASP, 127, 584 [NASA ADS] [CrossRef] [Google Scholar]
- Riener, M., Faesi, C. M., Forbrich, J., & Lada, C. J. 2018, A&A, 612, A81 [NASA ADS] [CrossRef] [EDP Sciences] [Google Scholar]
- Rigopoulou, D., Barale, M., Clary, D. C., et al. 2021, MNRAS, 504, 5287 [NASA ADS] [CrossRef] [Google Scholar]
- Robin, T., Kartha, S. S., Ujjwal, K., et al. 2024, A&A, 681, A7 [NASA ADS] [CrossRef] [EDP Sciences] [Google Scholar]
- Robotham, A. S. G., Davies, L. J. M., Driver, S. P., et al. 2018, MNRAS, 476, 3137 [NASA ADS] [CrossRef] [Google Scholar]
- Sandstrom, K. M., Chastenet, J., Sutter, J., et al. 2023, ApJ, 944, L7 [NASA ADS] [CrossRef] [Google Scholar]
- Santoro, F., Kreckel, K., Belfiore, F., et al. 2022, A&A, 658, A188 [NASA ADS] [CrossRef] [EDP Sciences] [Google Scholar]
- Schlafly, E. F., & Finkbeiner, D. P. 2011, ApJ, 737, 103 [Google Scholar]
- Siebenmorgen, R., Krügel, E., & Spoon, H. W. W. 2004, A&A, 414, 123 [NASA ADS] [CrossRef] [EDP Sciences] [Google Scholar]
- Singh, S., Ashby, M. L. N., Vig, S., et al. 2021, MNRAS, 504, 4143 [NASA ADS] [CrossRef] [Google Scholar]
- Smith, J. D. T., Draine, B. T., Dale, D. A., et al. 2007, ApJ, 656, 770 [Google Scholar]
- Tandon, S. N., Subramaniam, A., Girish, V., et al. 2017, AJ, 154, 128 [NASA ADS] [CrossRef] [Google Scholar]
- Tandon, S. N., Postma, J., Joseph, P., et al. 2020, AJ, 159, 158 [Google Scholar]
- Tielens, A. G. G. M. 2008, ARA&A, 46, 289 [NASA ADS] [CrossRef] [Google Scholar]
- Tielens, A. G. G. M., Seab, C. G., Hollenbach, D. J., & McKee, C. F. 1987, ApJ, 319, L109 [NASA ADS] [CrossRef] [Google Scholar]
- Ujjwal, K., Kartha, S. S., Subramanian, S., et al. 2022, MNRAS, 516, 2171 [CrossRef] [Google Scholar]
- Voit, G. M. 1992, MNRAS, 258, 841 [NASA ADS] [CrossRef] [Google Scholar]
- Wu, Y., Charmandaris, V., Hao, L., et al. 2006, ApJ, 639, 157 [NASA ADS] [CrossRef] [Google Scholar]
- Xie, Y., & Ho, L. C. 2019, ApJ, 884, 136 [CrossRef] [Google Scholar]
- Yadav, J., Das, M., Patra, N. N., et al. 2021, ApJ, 914, 54 [Google Scholar]
All Tables
All Figures
|
Fig. 1. UVIT and JWST images of the sample of galaxies are shown in the top and bottom panels. The field of the JWST observation is marked in the UVIT FUV images. The UVIT footprint with the JWST observation and the corresponding JWST color-composite image of the sample of galaxies are shown in the bottom panel. The JWST color-composite images are generated using the F770W, F1130W, and F2100W filters, which are color-coded in blue, green, and red, respectively. The blue ellipses in the UVIT footprints in the lower panel represent the PAH bright regions identified using ProFound. For all the images, north is up and east is to the left. |
| In the text | |
|
Fig. 2. Variation in the running median of the band ratios corresponding to the ΣSFR. Panels A, B, and C represent the band ratios F335MPAH/F1130W, F335MPAH/F770W, and F770W/F1130W, respectively. The blue cross, green hexagon, and red plus represent the galaxies NGC 628, NGC1365, and NGC 7496, respectively. The associated standard mean error is also represented. |
| In the text | |
|
Fig. 3. KDE plot representing the band ratios in the galaxy sample with respect to the ΣSFR. The PAH bright regions are classified into high star-forming and low star-forming regions, based on the ΣSFR of the associated star-forming regions. Blue represents the regions with high ΣSFR, and red represents the regions with low ΣSFR. |
| In the text | |
Current usage metrics show cumulative count of Article Views (full-text article views including HTML views, PDF and ePub downloads, according to the available data) and Abstracts Views on Vision4Press platform.
Data correspond to usage on the plateform after 2015. The current usage metrics is available 48-96 hours after online publication and is updated daily on week days.
Initial download of the metrics may take a while.