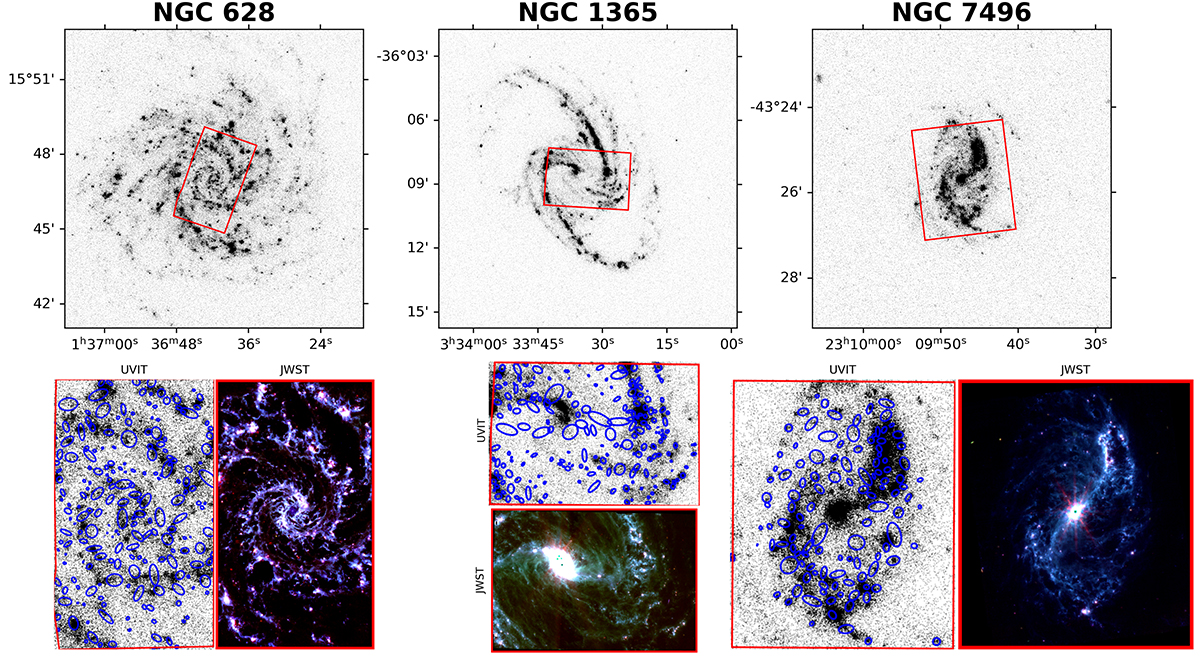
Fig. 1.
Download original image
UVIT and JWST images of the sample of galaxies are shown in the top and bottom panels. The field of the JWST observation is marked in the UVIT FUV images. The UVIT footprint with the JWST observation and the corresponding JWST color-composite image of the sample of galaxies are shown in the bottom panel. The JWST color-composite images are generated using the F770W, F1130W, and F2100W filters, which are color-coded in blue, green, and red, respectively. The blue ellipses in the UVIT footprints in the lower panel represent the PAH bright regions identified using ProFound. For all the images, north is up and east is to the left.
Current usage metrics show cumulative count of Article Views (full-text article views including HTML views, PDF and ePub downloads, according to the available data) and Abstracts Views on Vision4Press platform.
Data correspond to usage on the plateform after 2015. The current usage metrics is available 48-96 hours after online publication and is updated daily on week days.
Initial download of the metrics may take a while.