Open Access
Fig. 3.
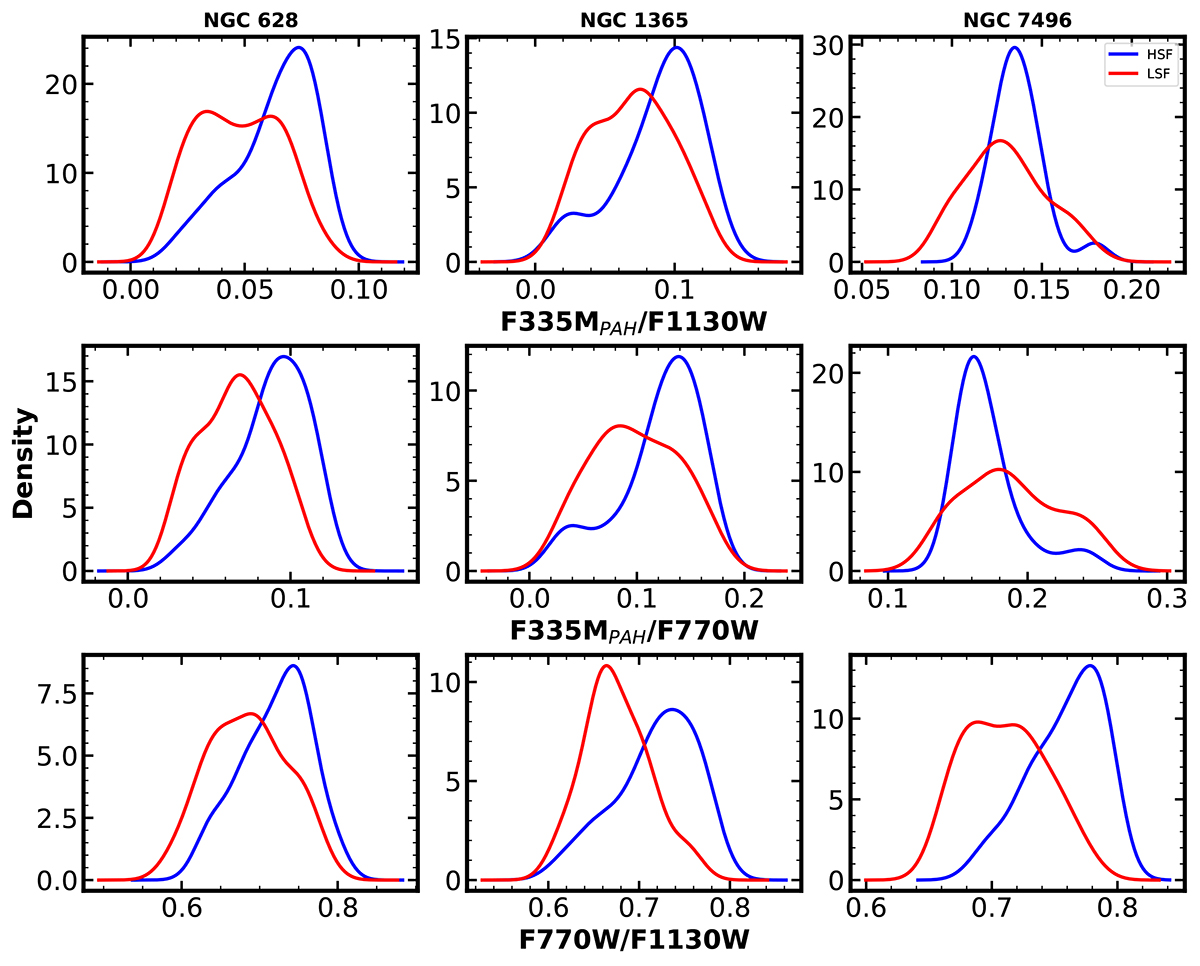
Download original image
KDE plot representing the band ratios in the galaxy sample with respect to the ΣSFR. The PAH bright regions are classified into high star-forming and low star-forming regions, based on the ΣSFR of the associated star-forming regions. Blue represents the regions with high ΣSFR, and red represents the regions with low ΣSFR.
Current usage metrics show cumulative count of Article Views (full-text article views including HTML views, PDF and ePub downloads, according to the available data) and Abstracts Views on Vision4Press platform.
Data correspond to usage on the plateform after 2015. The current usage metrics is available 48-96 hours after online publication and is updated daily on week days.
Initial download of the metrics may take a while.