Fig. 2.
Download original image
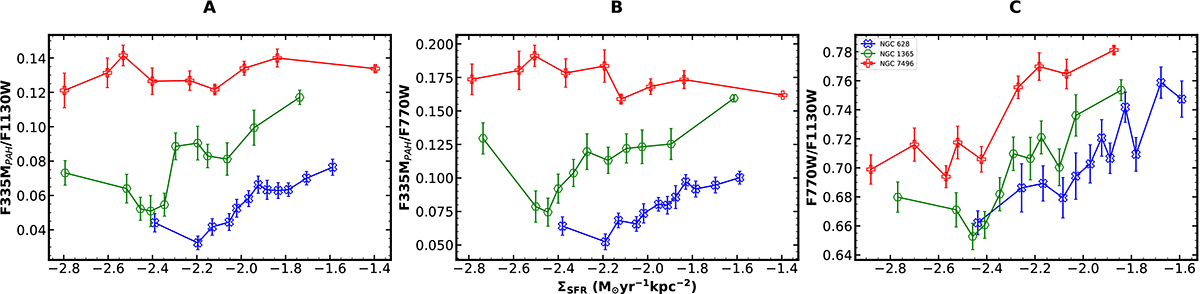
Variation in the running median of the band ratios corresponding to the ΣSFR. Panels A, B, and C represent the band ratios F335MPAH/F1130W, F335MPAH/F770W, and F770W/F1130W, respectively. The blue cross, green hexagon, and red plus represent the galaxies NGC 628, NGC1365, and NGC 7496, respectively. The associated standard mean error is also represented.
Current usage metrics show cumulative count of Article Views (full-text article views including HTML views, PDF and ePub downloads, according to the available data) and Abstracts Views on Vision4Press platform.
Data correspond to usage on the plateform after 2015. The current usage metrics is available 48-96 hours after online publication and is updated daily on week days.
Initial download of the metrics may take a while.