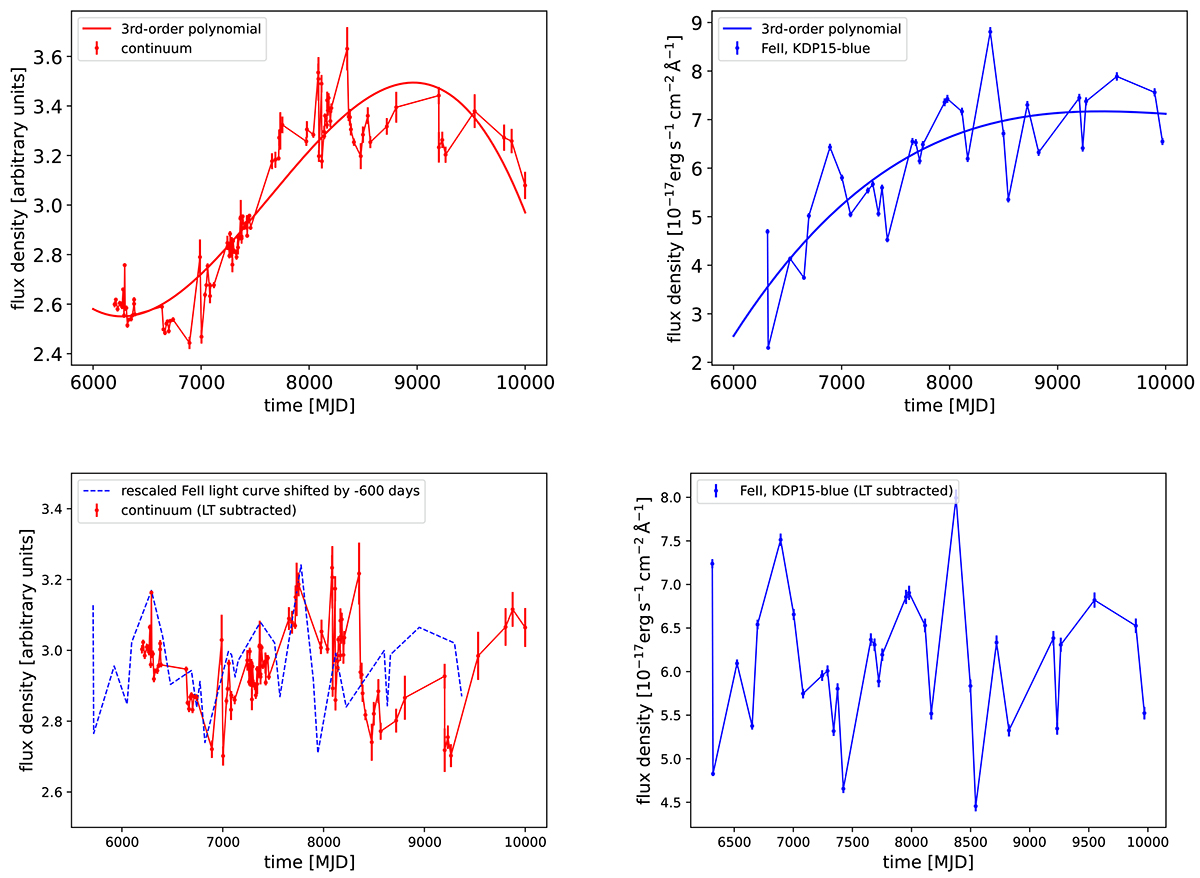
Fig. 9.
Download original image
Time-delay analysis using the long-term (hereafter LT) trend subtraction from continuum and FeII emission light curves. Upper panels: Continuum (left) and FeII emission light curve (right), which was inferred using the KDP15 template considering the more prominent blue wing, with the corresponding 3rd-order polynomial fits. Lower panels: Continuum and FeII emission light curves in the left and the right panels, respectively, after the LT trend was subtracted from both of them. The final light curves were reconstructed by adding the mean flux density value of the corresponding original light curves. In the left panel for the continuum light curve, we also show the rescaled FeII light curve shifted by −600 days, which corresponds to the ICCF maximum for this case.
Current usage metrics show cumulative count of Article Views (full-text article views including HTML views, PDF and ePub downloads, according to the available data) and Abstracts Views on Vision4Press platform.
Data correspond to usage on the plateform after 2015. The current usage metrics is available 48-96 hours after online publication and is updated daily on week days.
Initial download of the metrics may take a while.