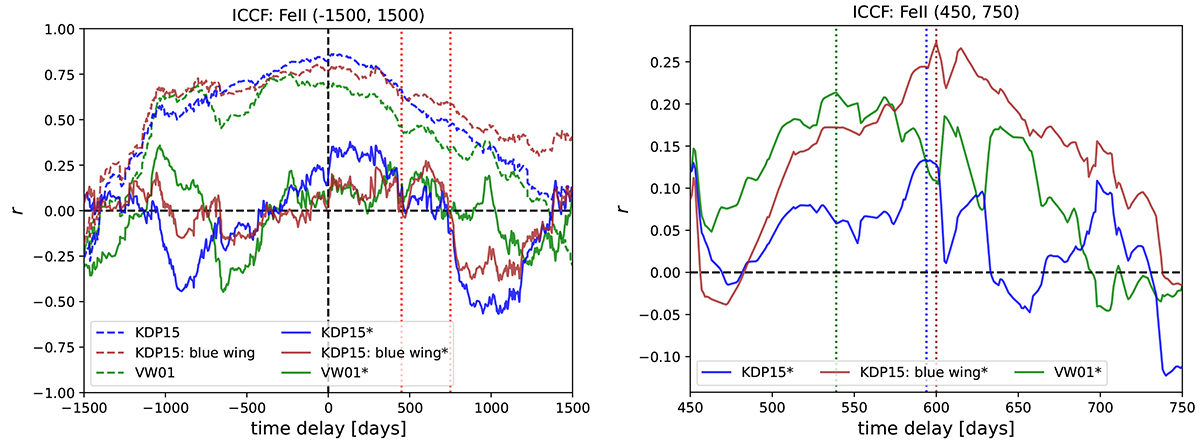
Fig. 8.
Download original image
ICCF for the FeII emission using different FeII templates (KDP15 and VW01). Left panel: The ICCF for the FeII templates KDP15, KDP15–blue wing, and VW01 without the long-term subtraction (dashed lines). By subtracting the long-term trend from the continuum and line-emission light curves, the ICCF becomes asymmetric with respect to zero (solid lines) and the time-delay peak between 450 and 750 days can be identified, especially for the blue-wing part of the KDP15 template. Right panel: The ICCF for all the three considered cases (KDP15, KDP15–blue wing, VW01) in the interval between 450 and 750 days in the observer’s frame. For the best-fitting KDP15 template, the cross-correlation peak is at ∼600 days. See Table 4 for the summary of the peak and the centroid values (last three rows).
Current usage metrics show cumulative count of Article Views (full-text article views including HTML views, PDF and ePub downloads, according to the available data) and Abstracts Views on Vision4Press platform.
Data correspond to usage on the plateform after 2015. The current usage metrics is available 48-96 hours after online publication and is updated daily on week days.
Initial download of the metrics may take a while.