Fig. A.8.
Download original image
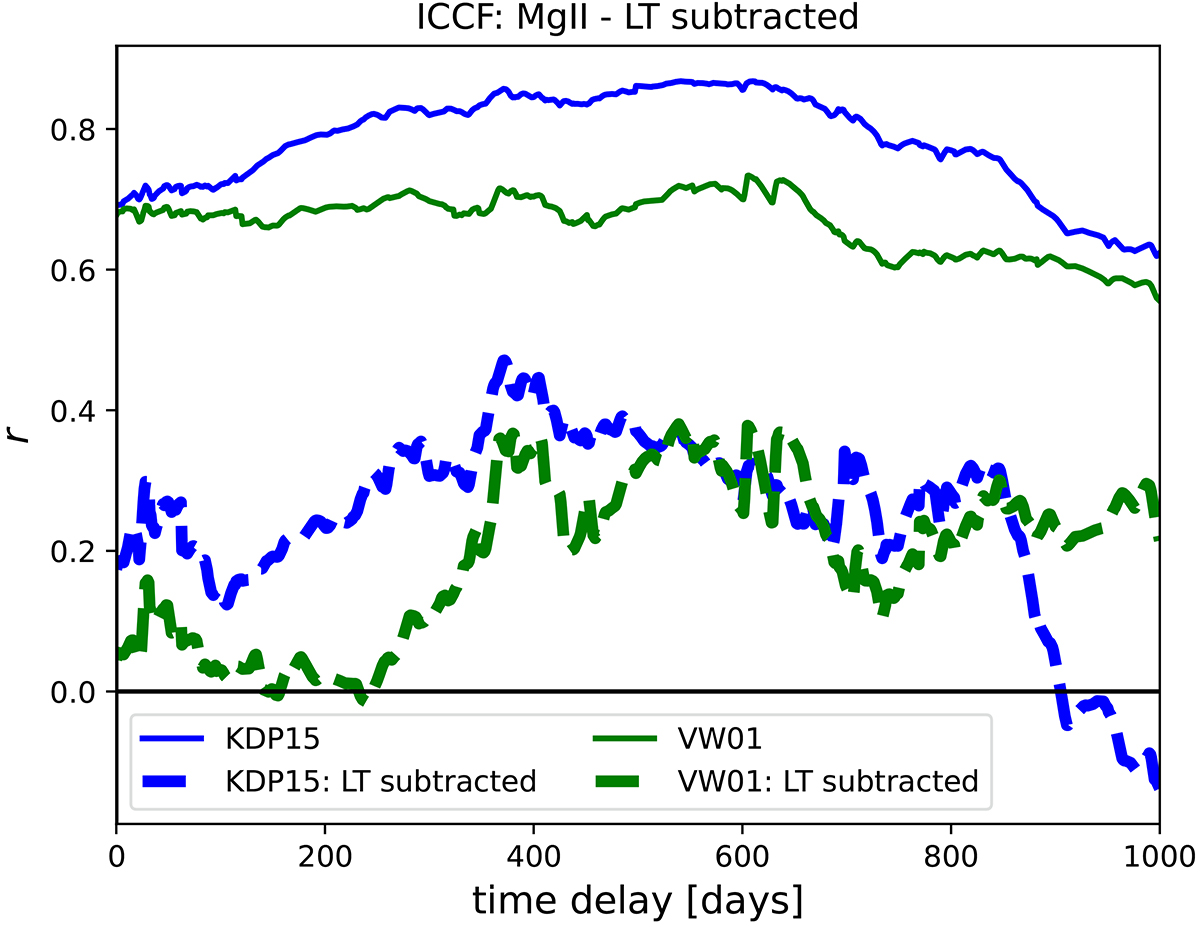
ICCF as a function of the time delay in the observer’s frame for the MgII light curve with the LT trend subtraction. Solid lines correspond to the original light curves (blue for the KDP15 template and green for the VW01 template). Dashed lines correspond to the continuum and the MgII light curves with the LT trend subtracted using the third-order polynomial to represent the LT trend (a blue dashed line stands for the KDP15 template, while the green dashed line corresponds to the VW01 template). Although a significant drop in the correlation coefficient is noticeable, the main time-delay peak around ∼400 − 600 days can be recovered.
Current usage metrics show cumulative count of Article Views (full-text article views including HTML views, PDF and ePub downloads, according to the available data) and Abstracts Views on Vision4Press platform.
Data correspond to usage on the plateform after 2015. The current usage metrics is available 48-96 hours after online publication and is updated daily on week days.
Initial download of the metrics may take a while.