Fig. A.7.
Download original image
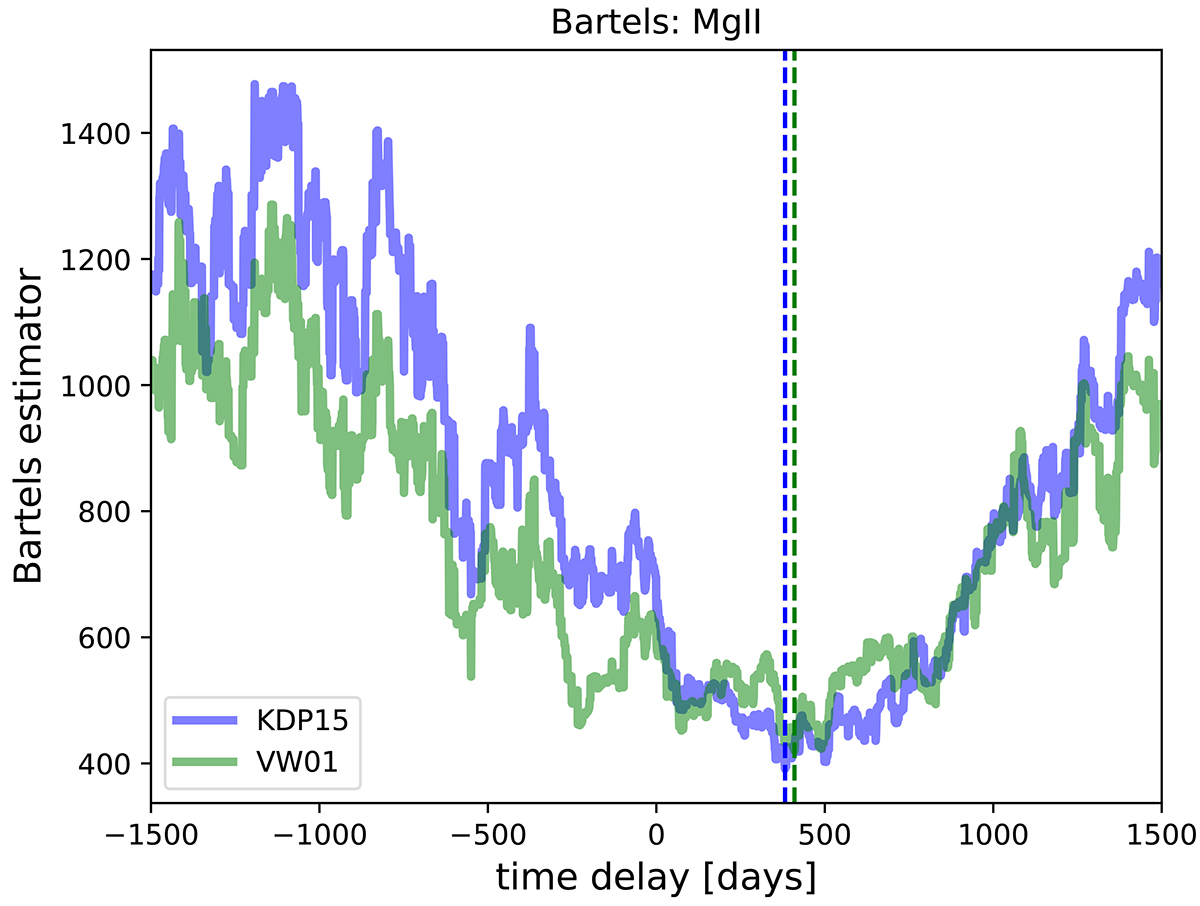
Bartels estimator as a function of a time delay (in the observer’s frame) for the MgII emission using the KDP15 and the VW01 templates depicted by blue and the green lines, respectively. The dashed vertical lines depict the time delays corresponding to the estimator minima at 382 days (KDP15) and 410 days (VW01), respectively.
Current usage metrics show cumulative count of Article Views (full-text article views including HTML views, PDF and ePub downloads, according to the available data) and Abstracts Views on Vision4Press platform.
Data correspond to usage on the plateform after 2015. The current usage metrics is available 48-96 hours after online publication and is updated daily on week days.
Initial download of the metrics may take a while.