Fig. A.5.
Download original image
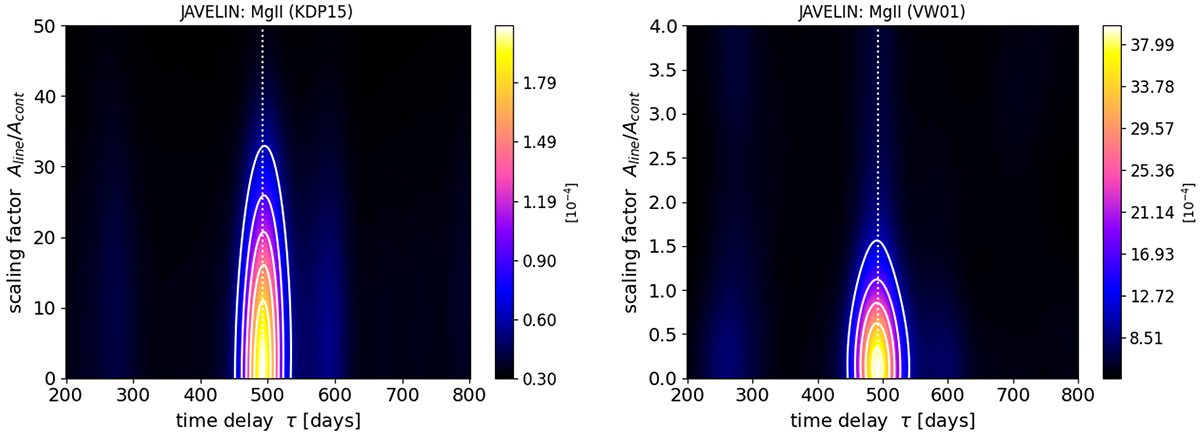
Heat map with contours for the posterior distributions of the scaling factor vs. the time delay (in the observer’s frame) as determined by the JAVELIN method for the MgII emission light curve. We performed the analysis using the KDP15 FeII template (left panel) and the VW01 FeII template (right panel). The dashed vertical line depicts the time-delay peak at 492.5 days, which is the same for both FeII templates. The color scale depicts the Gaussian kernel density of MCMC realizations (altogether 40 000) in the scaling factor–time delay plane with the grid of 400 × 400 bins.
Current usage metrics show cumulative count of Article Views (full-text article views including HTML views, PDF and ePub downloads, according to the available data) and Abstracts Views on Vision4Press platform.
Data correspond to usage on the plateform after 2015. The current usage metrics is available 48-96 hours after online publication and is updated daily on week days.
Initial download of the metrics may take a while.