Open Access
Fig. A.3.
Download original image
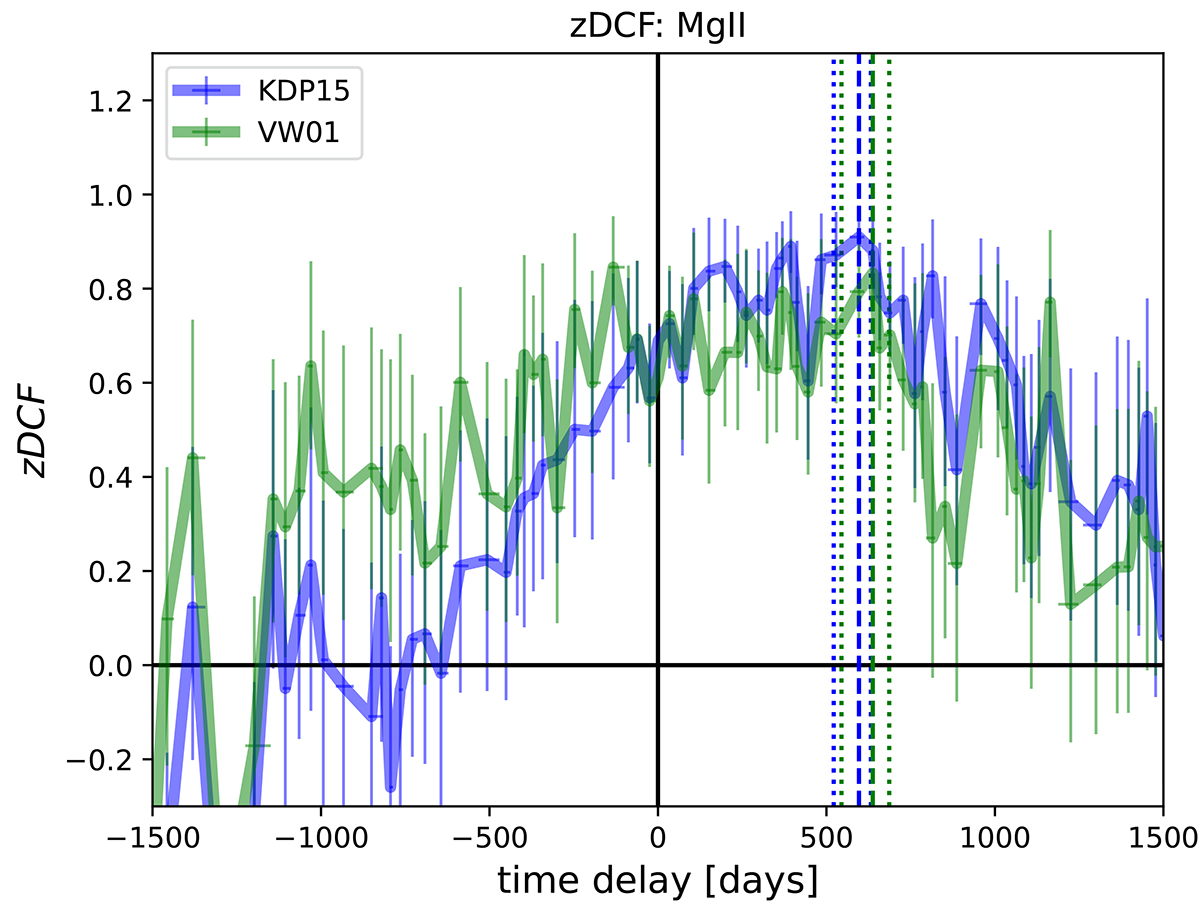
zDCF for the MgII emission using the KDP15 and the VW01 templates depicted by blue and green lines, respectively, with the corresponding error bars. The dashed vertical lines show the time-delay peaks at 597 days (KDP15) and 638 days (VW01) while the dotted lines mark the corresponding 1σ uncertainties.
Current usage metrics show cumulative count of Article Views (full-text article views including HTML views, PDF and ePub downloads, according to the available data) and Abstracts Views on Vision4Press platform.
Data correspond to usage on the plateform after 2015. The current usage metrics is available 48-96 hours after online publication and is updated daily on week days.
Initial download of the metrics may take a while.