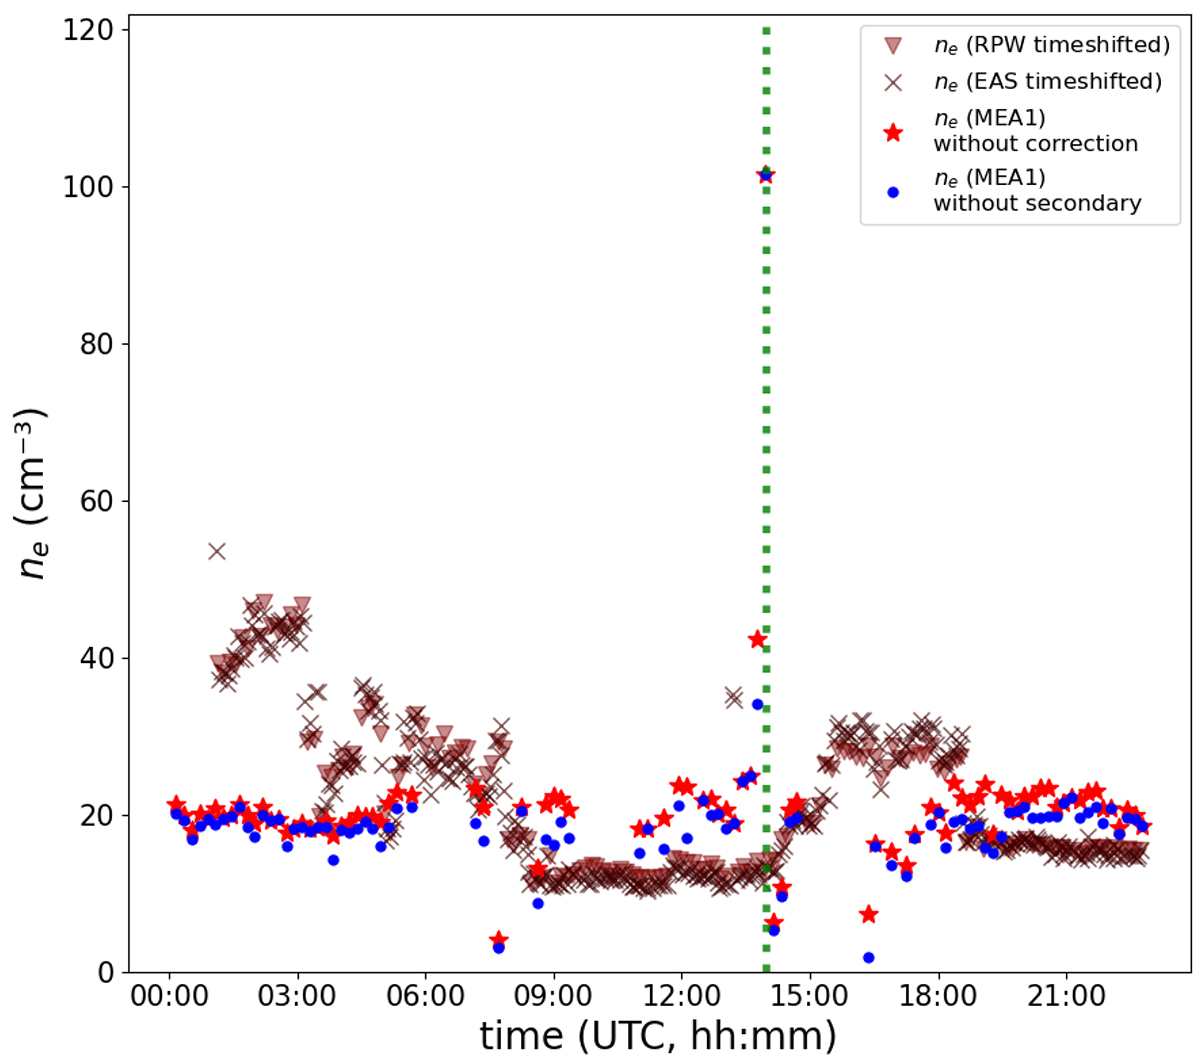
Fig. 6.
Download original image
Time evolution of ne (in cm−3) during the VFB on August 10, 2021. The brown triangles and crosses represent ne measured by RPW and EAS respectively, time-shifted to the location of BepiColombo. The red stars represent ne after the integration of the entire electron energy spectra without applying any corrections, while the blue dots represent ne after the integration of the entire electron spectra with the secondary electrons removed. The green dotted line indicates the time of the bow shock crossing of the induced magnetosphere of Venus by BepiColombo.
Current usage metrics show cumulative count of Article Views (full-text article views including HTML views, PDF and ePub downloads, according to the available data) and Abstracts Views on Vision4Press platform.
Data correspond to usage on the plateform after 2015. The current usage metrics is available 48-96 hours after online publication and is updated daily on week days.
Initial download of the metrics may take a while.