Fig. 5.
Download original image
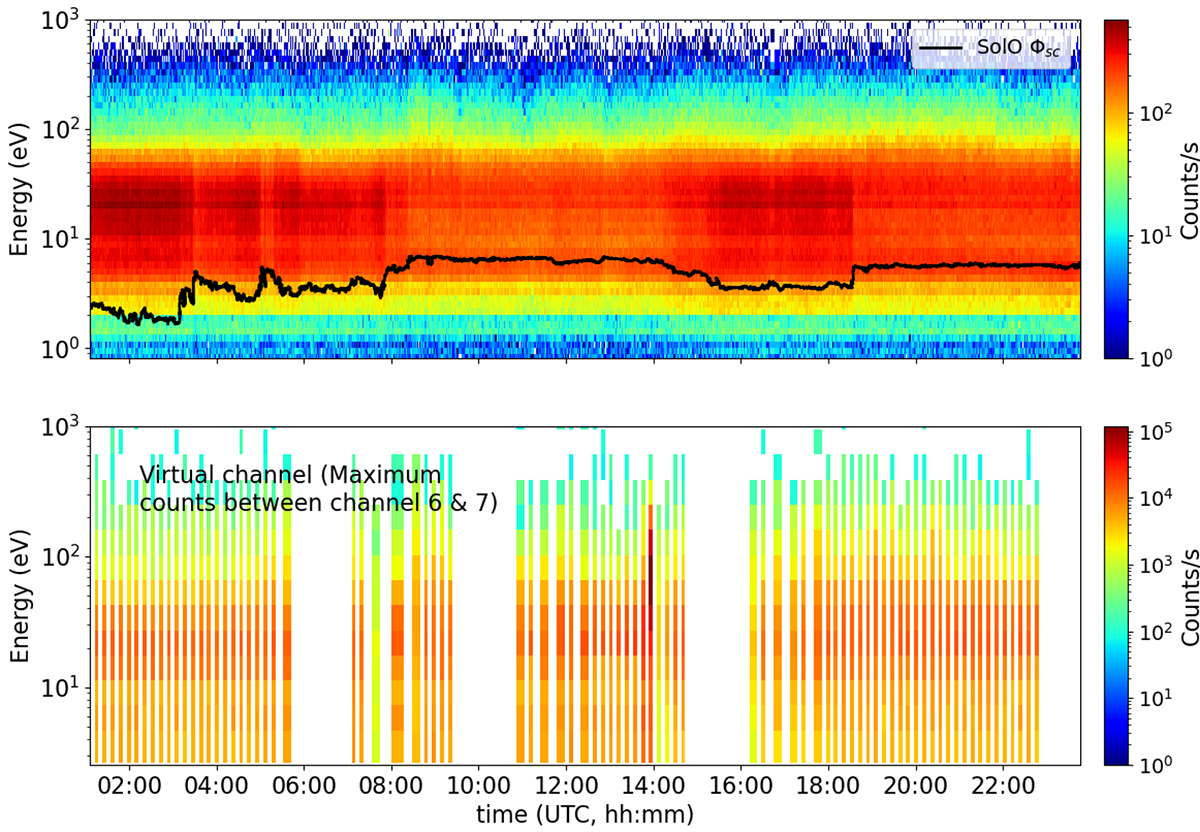
Comparison between electron energy spectrograms measured by EAS and MEA 1. Upper panel: time-energy spectrogram of electron count rates measured by EAS and time-shifted to the location of BepiColombo during its second Venus flyby on August 10, 2021, with the superimposed spacecraft potential of SolO measured by RPW ΦSolO (in black). Lower panel: time-energy spectrogram of electron count rates built with the virtual channel extracted from the MEA 1 3D data products.
Current usage metrics show cumulative count of Article Views (full-text article views including HTML views, PDF and ePub downloads, according to the available data) and Abstracts Views on Vision4Press platform.
Data correspond to usage on the plateform after 2015. The current usage metrics is available 48-96 hours after online publication and is updated daily on week days.
Initial download of the metrics may take a while.