Fig. 2.
Download original image
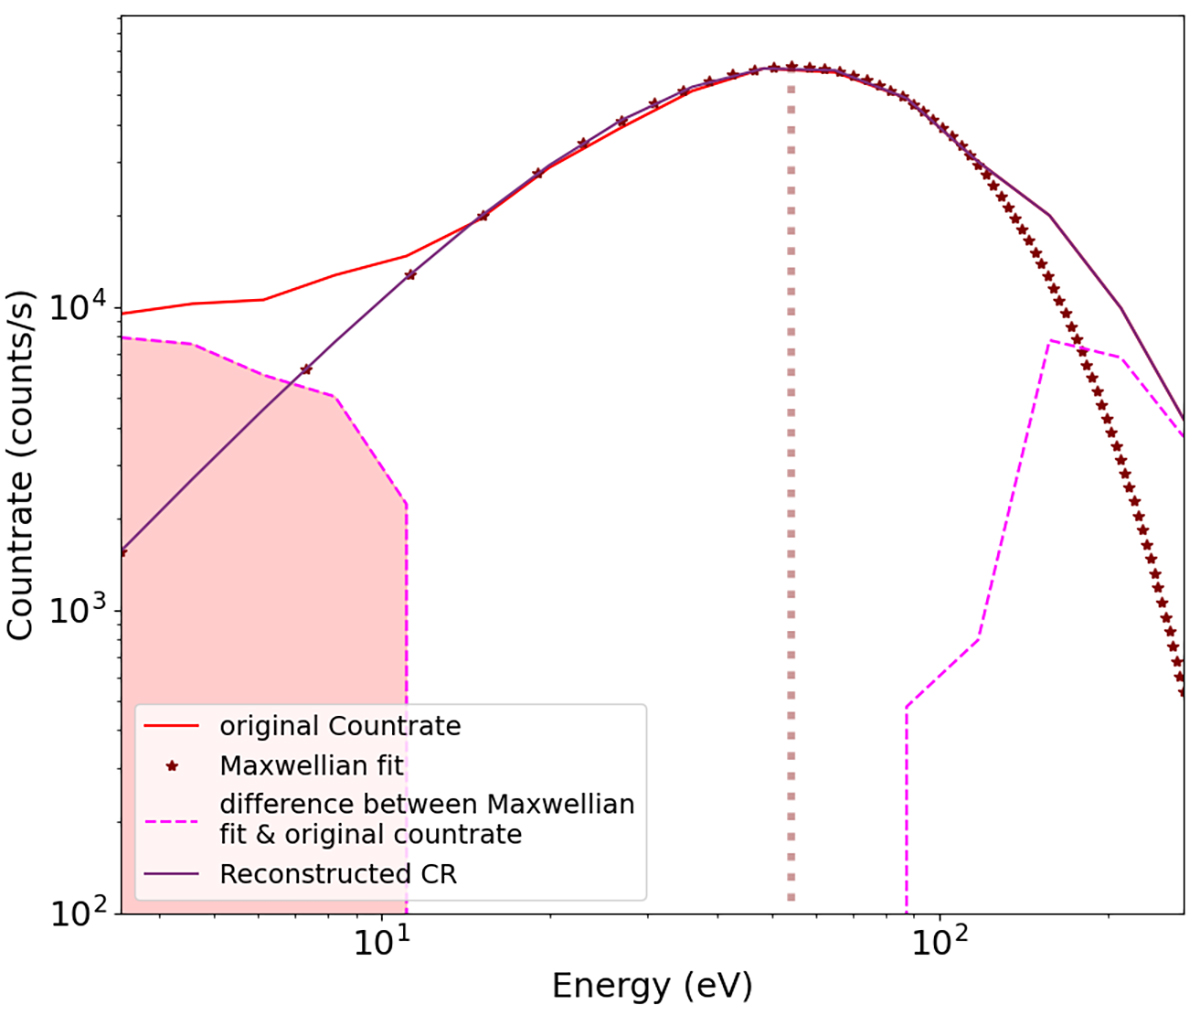
Illustration of the procedure applied to remove the secondary electron emission contribution from a complete electron energy spectrum measured by MEA 1 on March 11, 2022, at 19:39:40 UTC. The red line corresponds to the original count rate, the brown stars are a Maxwellian fit of the original count rate. The magenta dotted lines represent the residuals at low and high energies when the Maxwellian fit has been subtracted from the original count rates. Finally, the brown line shows the reconstructed corrected count rate.
Current usage metrics show cumulative count of Article Views (full-text article views including HTML views, PDF and ePub downloads, according to the available data) and Abstracts Views on Vision4Press platform.
Data correspond to usage on the plateform after 2015. The current usage metrics is available 48-96 hours after online publication and is updated daily on week days.
Initial download of the metrics may take a while.