Fig. 17.
Download original image
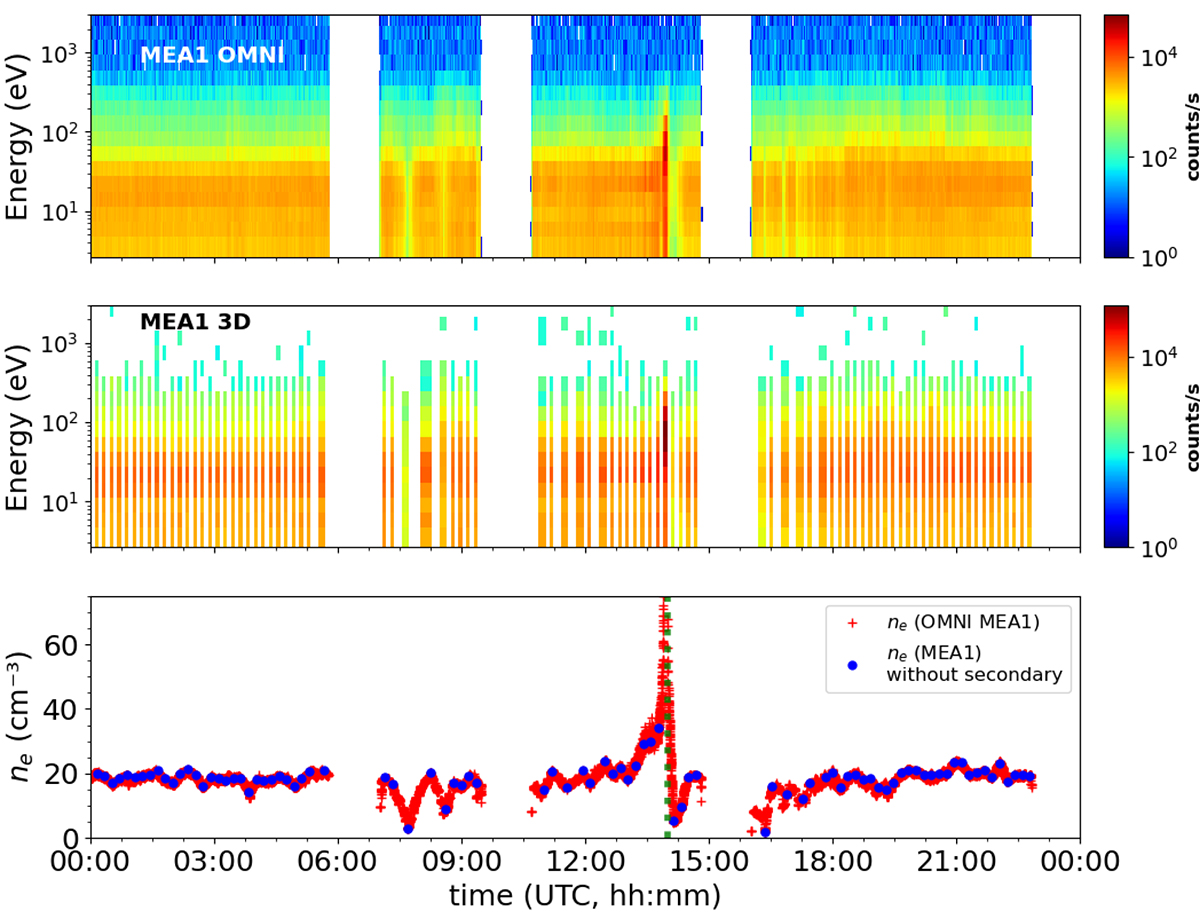
Comparison of Omni and 3D electron energy spectra and the density derived from the 3D and Omni data product. Upper panel: Omni count rate energy spectra measured on August 10, 2021, with MEA 1. Middle panel: 3D virtual channel count rate energy spectra measured on the same day with MEA 1. Lower panel: comparison of the ne, 3D calculated from 3D data product without secondary electrons and ne, Omni shifted at ne, 3D (blue dots and red plus signs, respectively). The vertical green dotted line represents the bow shock crossing.
Current usage metrics show cumulative count of Article Views (full-text article views including HTML views, PDF and ePub downloads, according to the available data) and Abstracts Views on Vision4Press platform.
Data correspond to usage on the plateform after 2015. The current usage metrics is available 48-96 hours after online publication and is updated daily on week days.
Initial download of the metrics may take a while.