Fig. 13.
Download original image
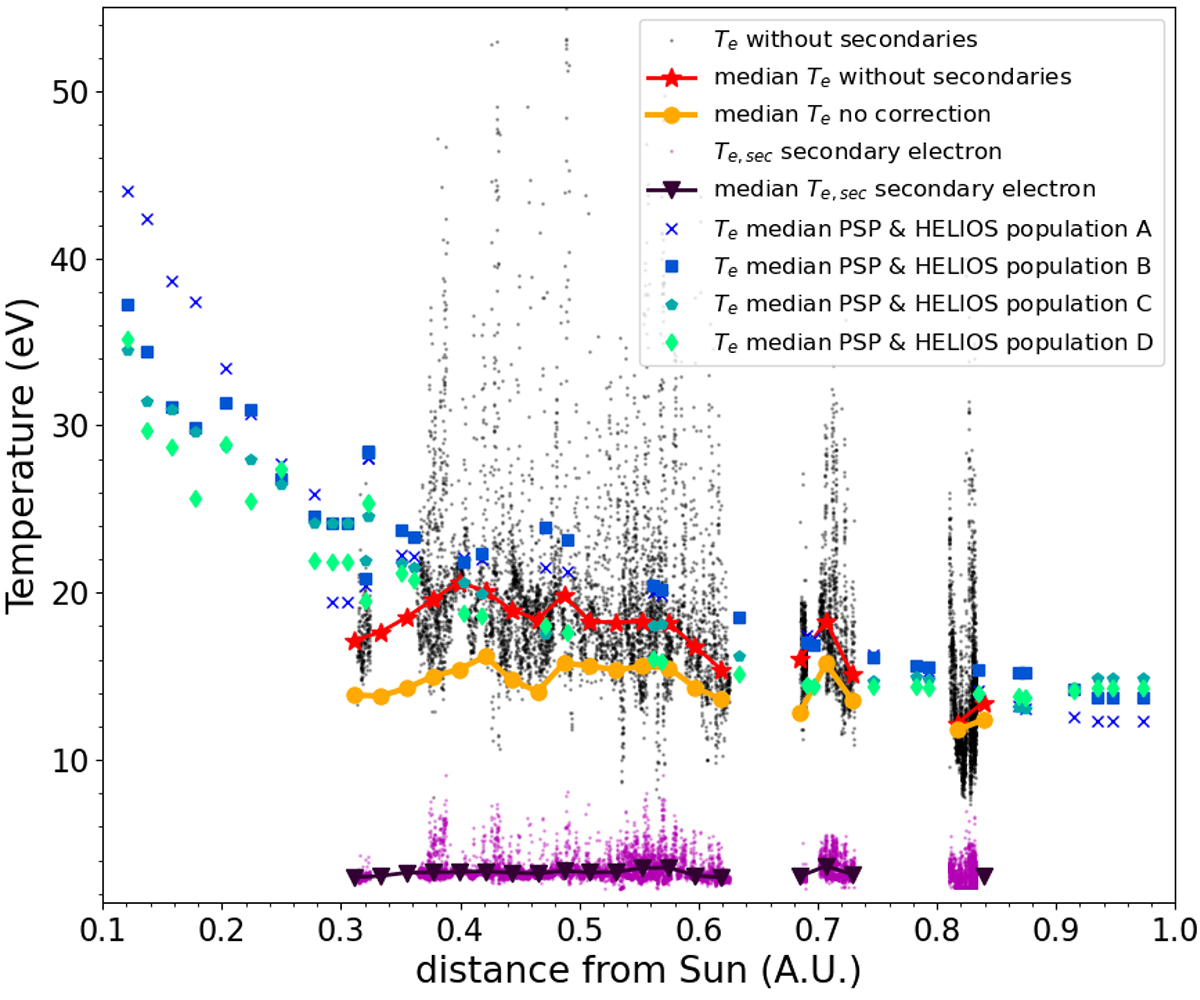
Statistical evolution of the electron temperature Te (in eV) with respect to the distance of the Sun. The black dots, the red stars, and the yellow tripod solid line stand for Te and the median of Te determined with and without the secondary electrons removed, respectively. The purple dots and triangles correspond to Te, sec and its median, determined from integrating the residuals at low energies (see text for more details). The color gradients with crosses, squares, pentagons, and diamonds represent the median Te for four different SW populations (A, B, C, and D), extracted from the PSP and HELIOS missions by Dakeyo et al. (2022).
Current usage metrics show cumulative count of Article Views (full-text article views including HTML views, PDF and ePub downloads, according to the available data) and Abstracts Views on Vision4Press platform.
Data correspond to usage on the plateform after 2015. The current usage metrics is available 48-96 hours after online publication and is updated daily on week days.
Initial download of the metrics may take a while.