Fig. 12.
Download original image
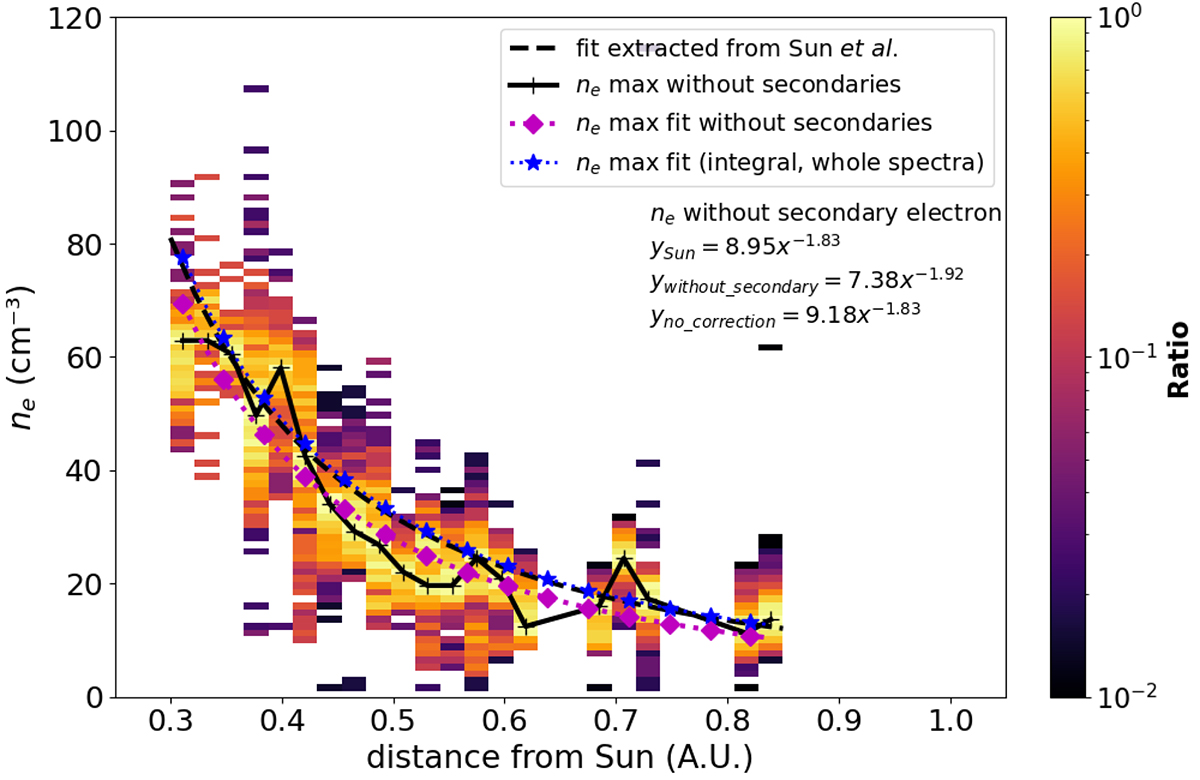
Statistical evolution of the electron density ne (in cm−3) measured by MEA1 with respect to the distance to the Sun. The colormap represents a 2D distribution, with 25 bins for the distance and 100 bins for the density. ne is estimated from MEA by removing the contribution of the secondary electrons. For each distance bin, the density distribution is normalized by its maximum value. The solid black line links all the density maxima at each distance bin. Three power-law fits are represented: the black dashed line, the blue stars, and the purple diamonds for the Sun et al. (2022) fit, ne without the secondary electrons removed, and ne with the secondary electrons removed, respectively.
Current usage metrics show cumulative count of Article Views (full-text article views including HTML views, PDF and ePub downloads, according to the available data) and Abstracts Views on Vision4Press platform.
Data correspond to usage on the plateform after 2015. The current usage metrics is available 48-96 hours after online publication and is updated daily on week days.
Initial download of the metrics may take a while.