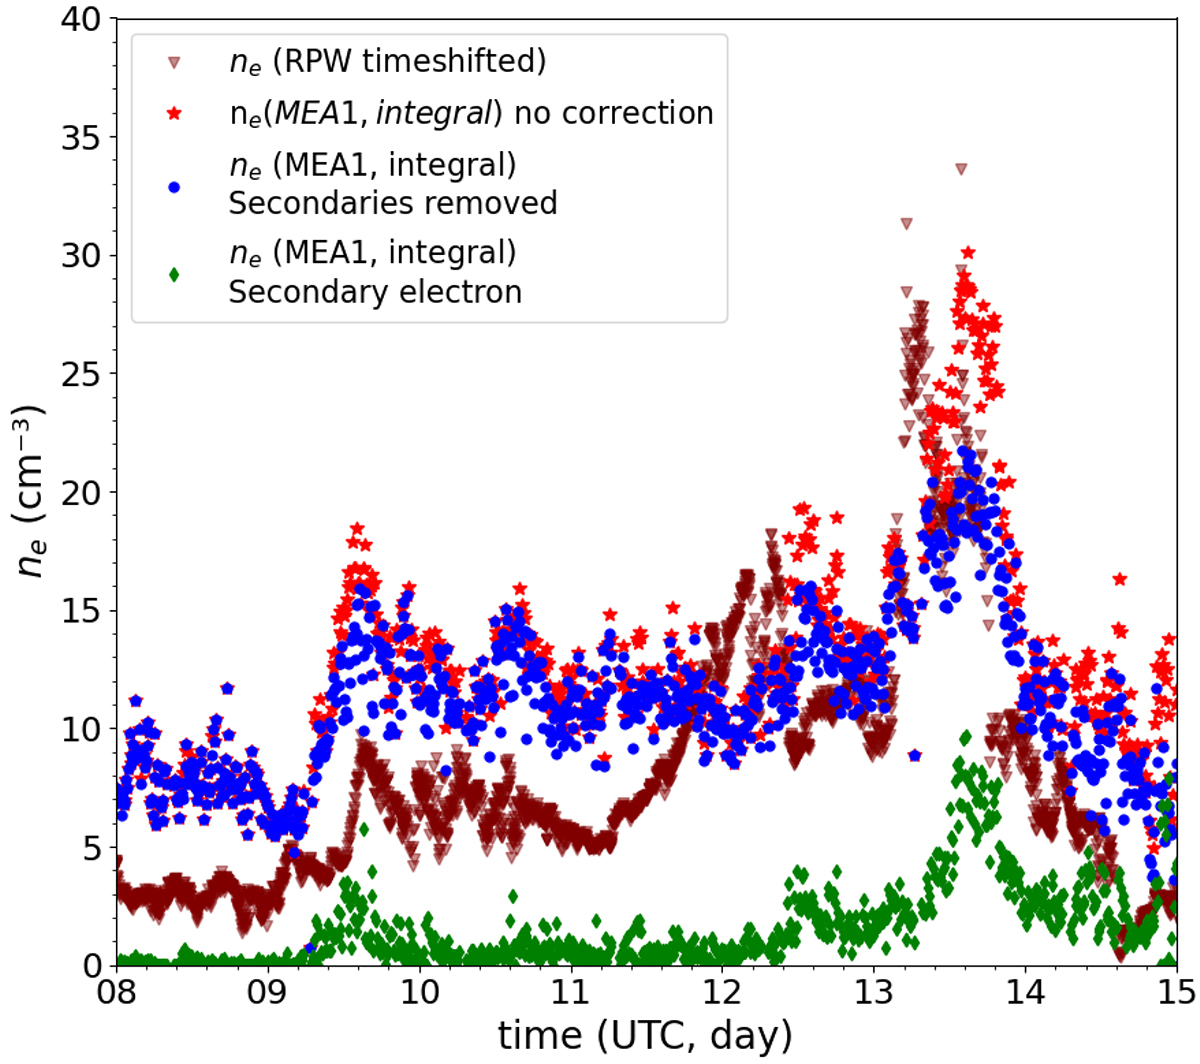
Fig. 10.
Download original image
Time evolution of the electron density ne (in cm−3), from July 8 to 15, 2021. The brown triangles represent ne measured by RPW and time-shifted at the location of BepiColombo. The red stars and the blue dots are the density calculated with MEA 1, without and with the secondary electrons removed, respectively. The green diamonds correspond to the density of secondary electrons deduced by integrating the residuals at low energies (see details in the text).
Current usage metrics show cumulative count of Article Views (full-text article views including HTML views, PDF and ePub downloads, according to the available data) and Abstracts Views on Vision4Press platform.
Data correspond to usage on the plateform after 2015. The current usage metrics is available 48-96 hours after online publication and is updated daily on week days.
Initial download of the metrics may take a while.