| Issue |
A&A
Volume 683, March 2024
|
|
|---|---|---|
| Article Number | A109 | |
| Number of page(s) | 9 | |
| Section | The Sun and the Heliosphere | |
| DOI | https://doi.org/10.1051/0004-6361/202347579 | |
| Published online | 11 March 2024 | |
Multithermal apparent damping of slow waves due to strands with a Gaussian temperature distribution
1
Centre for mathematical Plasma Astrophysics, Department of Mathematics, KU Leuven, Celestijnenlaan 200B, 3001 Leuven, Belgium
e-mail: This email address is being protected from spambots. You need JavaScript enabled to view it.
2
Aryabhatta Research Institute of Observational Sciences, Nainital, India
3
Indian Institute of Astrophysics, Koramangala, 560034 Bengaluru, India
4
Center of Excellence in Space Sciences, IISER, 741246 Kolkata, India
5
School of Mathematics and Statistics, University of St Andrews, St Andrews, Fife KY16 9SS, UK
Received:
27
July
2023
Accepted:
23
December
2023
Abstract
Context. Slow waves in solar coronal loops are strongly damped, but the current theory of damping by thermal conduction cannot explain some observational features.
Aims. We investigated the propagation of slow waves in a coronal loop built up from strands of different temperatures.
Methods. We considered the loop to have a multithermal, Gaussian temperature distribution. The different propagation speeds in different strands led to a multithermal apparent damping of the wave, similar to observational phase mixing. We used an analytical model to predict the damping length and propagation speed for the slow waves, including in imaging with filter telescopes.
Results. We compared the damping length due to this multithermal apparent damping with damping due to thermal conduction and found that the multithermal apparent damping is more important for shorter period slow waves. We quantified the influence of instrument filters on the wave’s propagation speed and damping. This allowed us to compare our analytical theory to forward models of numerical simulations.
Conclusions. We find that our analytical model matches the numerical simulations very well. Moreover, we offer an outlook for using the slow wave properties to infer the loop’s thermal properties.
Key words: magnetohydrodynamics (MHD) / plasmas / waves / methods: analytical / methods: numerical / Sun: oscillations
© The Authors 2024
 Open Access article, published by EDP Sciences, under the terms of the Creative Commons Attribution License (https://creativecommons.org/licenses/by/4.0), which permits unrestricted use, distribution, and reproduction in any medium, provided the original work is properly cited.
This article is published in open access under the Subscribe to Open model. This email address is being protected from spambots. You need JavaScript enabled to view it. to support open access publication.
1. Introduction
Since the turn of the century, slow waves in coronal loops have been regularly observed through high resolution space observations (Berghmans & Clette 1999). These waves are observed as propagating intensity disturbances along open magnetic field or in the footpoint of loops (De Moortel et al. 2002; Krishna Prasad et al. 2012). In previous years, there was a debate on their interpretation in terms of slow waves or periodic flows (e.g. De Moortel et al. 2015), but for coronal loops or fans rooted in sunspots, there is a consensus that these are definitely slow waves driven by p-mode wave leakage in the sunspot (Banerjee et al. 2021).
Slow waves in coronal loops have been observed to be very heavily damped. Traditionally, it has been thought that the damping is caused by thermal conduction, as concluded in an extensive review of damping mechanisms by De Moortel & Hood (2003, 2004). Still, some of the observed properties of the damping may not be adequately explained by this traditional approach. For instance, in closed-field regions, the damping was found to scale with the period with a positive coefficient (Krishna Prasad et al. 2014), which is still more-or-less compatible with the damping by thermal conduction (Mandal et al. 2016). However, for open-field regions in coronal holes, the damping was found to scale with the period with a negative coefficient (Krishna Prasad et al. 2014, 2017), which is incompatible with that damping theory. Gupta (2014) found different damping behaviours in slow waves at different heights. At larger heights (10−70 Mm), they found shorter damping lengths for short period waves (as expected according to thermal conduction), but closer to the limb (< 10 Mm), the long period waves (> 6 min) appeared to damp faster. Additionally, Mandal et al. (2018) have shown through a statistical study that the damping length of slow waves in polar regions indeed displays a negative dependence on the oscillation period. Moreover, Krishna Prasad et al. (2019) found that the observed damping lengths of slow waves are much shorter than those expected from the theory of thermal conduction. Thus, it seems that other damping mechanisms are also at work.
Another point to consider is that the propagation speeds of slow modes in a loop seem to depend on the filter passband of the spacecraft that is used (King et al. 2003; Kiddie et al. 2012; Uritsky et al. 2013). This, too, seems to be incompatible with a slow mode wave propagating through a monolithic loop subject to damping by thermal conduction. It was originally attributed to the fact that two adjacent loops (or two loops aligned along the line of sight) would be observed in different filters. This may be correct, but it leaves the question as to why the slow waves are so coherently in phase between the observed structures.
Another reason for disagreeing with the damping of slow waves by thermal conduction is that slow waves were previously observed to be damped with a Gaussian envelope (Krishna Prasad et al. 2014). This feature cannot be explained by damping by thermal conduction nor by resonant damping of slow waves in the cusp continuum (Yu et al. 2017a,b; Geeraerts et al. 2022). The latter is despite the fact that resonant absorption of kink modes in the Alfvén continuum has been convincingly shown to result in a Gaussian damping profile (Pascoe et al. 2012, 2017, 2022). However, the mechanism at work for resonant absorption in the Alfvén continuum (Hood et al. 2013) does not seem to carry over to slow waves (Hood 2015, priv. comm.).
Furthermore, Wang et al. (2015) argued that the thermal conduction coefficient is significantly suppressed in observed coronal loops. Despite the suppression of the thermal conduction, they still found strong damping of slow waves. In their paper, they argued that this damping is caused by an enhanced compressive viscosity (Wang & Ofman 2019). However, in this work we offer a suggestion that may also explain the observed strong damping of slow waves without invoking unrealistically high viscosity coefficients (a factor 10 higher than normally considered, Wang & Ofman 2019). The model we propose does not need thermal conduction nor viscosity to result in apparent damping.
In DC heating models of the corona, it is thought that the loops are built out of isolated strands (e.g. Aschwanden et al. 2000) that are each individually heated by nanoflares. After this heating, the higher temperature is redistributed by thermal conduction only along the magnetic field and inhibited across (e.g. Williams et al. 2021, and references therein). The loop strands are consequently modelled as a collection of 1D field lines and their thermodynamic evolution. This is in contrast to numerical evidence that loop strands have a short lifetime because of the mixing by transverse waves (Magyar & Van Doorsselaere 2016). The latter would result in a more continuous transverse temperature profile perpendicular to the magnetic field (Judge 2023).
In models of AC heating, transverse waves lead to turbulent behaviour in the loop boundary and the entire cross-section (Karampelas & Van Doorsselaere 2018), resulting in patchy heating in the cross-section or in the turbulent layers (Van Doorsselaere et al. 2018; Shi et al. 2021). Despite the differences between AC and DC heating models, it is safe to say that coronal loops do not have a uniform temperature across their cross-section. This would have a major impact on the propagation properties of slow waves in those non-uniform temperature profiles. In this work, we show that this leads to extra apparent damping (which we call “multithermal apparent damping”, or MAD) and different propagation speeds in different filter channels. In the future, this will allow us to infer the thermal structure of coronal loops from the propagation and damping behaviour. Aside from the potential use of slow waves to probe the coronal thermal structure, they are also considered for their ability to diagnose the coronal heating function (Kolotkov et al. 2019) through their perturbation of the energy balance equation for the background corona. Thus, it seems that slow waves are the optimal magnetohydrodynamic (MHD) waves for the seismological study of thermal effects in the solar corona (perhaps only second to the entropy mode).
Even though our results were derived independently, it was pointed out in discussions at conferences that the physical effect we consider is the same effect that what was considered by Voitenko et al. (2005)1. They modelled the propagation of sound waves in a multistranded loop with strands drawn from a uniform distribution, as seen in a top hat-shaped instrumental filter. In this work, we go much beyond that initial description of this phenomena.
2. Results: Theoretical models
We modelled a coronal loop as a superposition of strands, each with their own temperature and associated sound speed vs. However, the model also carries over to a loop with a temperature continuously varying in its cross-section. Neither of these models have temperature variation along the magnetic field. In these models, a sound wave front is launched at the footpoint. We describe the propagation of the sound wave in the multithermal plasma.
2.1. Intuition
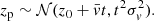
We took the z-direction along the uniform magnetic field and only considered the hydrodynamic behaviour along the magnetic field lines (e.g. De Moortel & Hood 2003; Voitenko et al. 2005; Mandal et al. 2016). We first considered the position zp of the peak perturbation on the strands. We had that
 (1)
(1)
where z0 is the height of the initial excitation of the wave in a strand with sound speed vs. We considered the initial position of the peak z0 to be independent of the strand, mimicking a joint impulsive excitation of the pulse low down in the atmosphere. In this paper, we consider a loop for which the strands have a sound speed that is randomly drawn from a normal distribution centred on  and the standard deviation σv
 (2)
(2)
The distribution of the temperature in these strands is tightly related to the heating mechanism, which is currently not well understood (e.g. Van Doorsselaere et al. 2020). Thus, this assumption of a Gaussian distribution of a strand’s sound speed is an ad hoc assumption in this paper. A sketch of the considered configuration is included in Fig. 1.
 |
Fig. 1. Schematic representation of the considered configuration. Three magnetic strands are shown. The cyan Gaussian pulses are excited at time t = 0 at z = z0 on all strands simultaneously. On each strand, the pulses propagate at a different speed, first to the blue line and then the purple line. The resultant observed intensity, as integrated over the different strands, is given by the red line, which shows the multithermal apparent damping and broadening. |
With such a Gaussian distribution of the strands, we then found that the peak positions zp are also a Gaussian distribution. Following well-known rules for transforming random variables in statistics, we found that the random variable’s distribution is
 (3)
(3)
We then considered that all the pulse perturbations on each strand have the same amplitude. The line-of-sight integration over all these strands then results in an intensity variation that is modelled well by Eq. (3). This equation shows that the peak position distribution (and integrated intensity signal) propagates up with the average sound speed  in the loop bundle. It also shows that the peak position distribution steadily widens linearly in time because its standard deviation has a tendency as tσv.
The crucial realisation for understanding the multithermal apparent damping of sound waves is that the normalising factor of the Gaussian distribution with a certain σ is given as  . Applying this for the distribution of zp, we found that its peak value will vary over time as
 (4)
(4)
and thus the wave will have a multithermal apparent damping that is proportional to t−1. Indeed, given that there is no dissipation (all the wave energy  is still in the infinitely long system), the damping is only apparent because of the spreading of the wave front over time. This is due to the different propagation speeds in each strand leading to an increasing spread in z. Thus, it is very similar to the process of phase mixing.
2.2. Gaussian pulses
We build on this intuition to describe a system with an initial Gaussian pulse in the density perturbation, which could be the result of an impulsive excitation at the footpoint of the loop because of granular buffeting or a reconnection event, for example. We imagined a group of strands all simultaneously excited with a pulse W(z, 0) of the form
 (5)
(5)
at position z0 and with pulse width w and amplitude a. Because of the propagation of the pulse on each individual strand, at a later time, it will appear as
 (6)
(6)
in which vs differs from strand to strand. A sketch of the configuration is shown in Fig. 1.
Next we look at the integrated signal for a Gaussian strand distribution for which  as before. We considered the integral of the different wavepackets (Eq. (6)), with the distribution of the strand’s sound speeds as the weight function. So in a sense, the integral computes the intensity of a line-of-sight integration through the multistranded loop with a Gaussian distribution in the DEM (differential emission measure, see e.g. Van Doorsselaere et al. 2018). The emission measure is defined as ∫zn2dz (with electron density n), which linearises to 2∫zn0n1dz for background density n0 and density perturbation n1. The integral over the line of sight covers all strands with density n0 in our loop model, and thus the wave perturbation W(z, t) has to be multiplied with the Gaussian strand distribution. Moreover, the integral over z (which traverses the entire loop system) is equivalent to integrating over all strands (in sound speed space).
With this reasoning, the total signal S(z, t) is then given as
 (7)
(7)
or
![Mathematical equation: $$ \begin{aligned} S(z,t)=\frac{a}{\sigma _v\sqrt{2\pi }} \int _{v_{\rm s}} \exp {\left(-\frac{1}{2}\left[\frac{(v_{\rm s}-\bar{v})^2}{\sigma _v^2}+\frac{(z-(z_0+v_{\rm s} t))^2}{{ w}^2}\right]\right)} \mathrm{d}v_{\rm s}. \end{aligned} $$](/articles/aa/full_html/2024/03/aa47579-23/aa47579-23-eq13.gif) (8)
(8)
Completing the square, the evaluation of the integral is given as
 (9)
(9)
This is a signal that peaks at  and thus propagates upwards with the average sound speed. Its Gaussian width (as a function of z) is given by
  , showing that it steadily increases in a hyperbolic fashion. For large t, the width increases approximately linearly.
As in Sect. 2.1, we also note here that the amplitude of the peak signal (at  , i.e. co-propagating with the wave) decreases steadily over time. Its decay d(t) from its initial amplitude is given as
 (10)
(10)
For a large time t, this scales thus as t−1, recovering the results of Sect. 2.1. These latter results may also be recovered by considering the limit of w → 0, corresponding to an initial δ-function perturbation.
In Fig. 2, we display the predicted damping envelope of Eq. (10) and compare it to a Monte Carlo simulation of a Gaussian wave packet on different strands. For the Monte Carlo simulation, we have drawn 1000 vs from the normal distribution  , with
  km s−1 (corresponding to 1 MK) and σv = 26.4 km s−1 (for a motivation of these particular values, see Sect. 3.2). The correspondence between the analytical solution and the Monte Carlo simulation is excellent.
 |
Fig. 2. Comparison of Monte Carlo simulation with the analytical result. The analytically predicted envelope (Eq. (10)) is drawn with a dark blue line. The progressive evolution in time of the Monte Carlo wave packet is indicated with the light blue to purple colour. The mean sound speed was taken as |

We may calculate the damping time τ as the e-folding time of this damping profile d(t). We would then have that
 (11)
(11)
resulting in
 (12)
(12)
With a substitution  , we may transform Eq. (10) to a damping profile as a function of Δz. We would find that
 (13)
(13)
Following the same reasoning as in the derivation of the damping time τ, we may also derive the damping length Ld:
 (14)
(14)
2.3. Driven waves
In this section, we consider the case of driven sinusoidal waves. At a certain height z = 0, a periodic driver is inserted, resulting in propagating waves asin(kz − ωt) with amplitude a, frequency ω, and wavenumber k. The resulting intensity signal of the loop bundle is then given as an integral (similar to Eq. (7))
 (15)
(15)
where we have used the dispersion relation k = ω/vs. The latter integral is not analytically solvable. We can still compare it to a Monte Carlo simulation with a 1000 vs drawn from a  distribution and summed up (see Fig. 3). The Monte Carlo simulation is shown with the blue line, while the full integral in Eq. (15) is shown with the light orange line. The two lines closely match, and the deviation is due to the finite number of drawn vs values. With a higher number of draws, the two lines converge.
 |
Fig. 3. Comparison of Monte Carlo simulation of driven sine functions (blue line) with the full integral (light orange) and the approximations in Eq. (19) (green). All functions have been normalised to the starting value of one. The expected Gaussian damping envelope (Eq. (26)) is shown in red. The time was arbitrarily chosen to be t = 0, and the mean sound speed 152 km s−1 and spread in sound speed σv = 26.4 km s−1 were chosen as before. |
Further analytical progress is possible by making a Taylor approximation of the denominator in the sine:
 (16)
(16)
 (17)
(17)
This approximation is valid if  . Since 95% of the contribution to the full integral (Eq. (15)) is for |δv|≤3σv, the Taylor approximation is reasonably satisfied for our considered parameters of
  km s−1 and σv = 26.4 km s−1, for which we subsequently have
  km s−1. So the assumption
  seems to be sufficiently well satisfied in loops that are not too extremely multithermal (i.e. with
  ). This Taylor approximation allows us to rewrite S(z, t) as
 (18)
(18)
It turns out that the rightmost integral in this expression is exactly zero, because its integrand is an odd function in δv. Thus, we have that
 (19)
(19)
The numerically calculated result of Eq. (19) is shown in Fig. 3 with the green line. It matches the Monte Carlo simulations (blue) and full integral (light orange) reasonably well. The integral in Eq. (19) can be calculated analytically by writing it as a complex function:
 (20)
(20)
We subsequently have
 (21)
(21)
![Mathematical equation: $$ \begin{aligned}&\quad = \mathfrak{R} \int _{\delta v} \exp {\left(-\left[\frac{\delta v}{\sqrt{2}\sigma _v}-\imath \frac{\sqrt{2}\sigma _v \omega z}{2\bar{v}^2}\right]^2-\frac{\sigma _v^2\omega ^2}{2\bar{v}^4}z^2\right)} \mathrm{d}\delta v\end{aligned} $$](/articles/aa/full_html/2024/03/aa47579-23/aa47579-23-eq40.gif) (22)
(22)
![Mathematical equation: $$ \begin{aligned}&\quad = \exp {\left(-\frac{\sigma _v^2\omega ^2}{2\bar{v}^4}z^2\right)} \mathfrak{R} \int _{\delta v} \exp {\left(-\left[\frac{\delta v}{\sqrt{2}\sigma _v}-\imath \frac{\sqrt{2}\sigma _v \omega z}{2\bar{v}^2}\right]^2 \right)} \mathrm{d}\delta v \end{aligned} $$](/articles/aa/full_html/2024/03/aa47579-23/aa47579-23-eq41.gif) (23)
(23)
 (24)
(24)
Inserting this into Eq. (19), we find as end result
 (25)
(25)
The wave is thus propagating with the average sound speed and additionally has a Gaussian damping envelope with a Gaussian damping length (keeping the traditional factor of two in the denominator, Pascoe et al. 2017)
 (26)
(26)
For the values considered in this paper ( km s−1, σv = 26.4 km s−1, ω = 2π/180 s), this reduces to a damping length of LG = 25.1 Mm.
The formula shows that the damping length is inversely proportional to the frequency. This is a different dependence than the thermal conduction damping length, which is proportional to ω−2. In Fig. 4, we compare the multithermal apparent damping to the damping by thermal conduction. For the latter, we have taken the results in Mandal et al. (2016), and these are shown with the blue line. The light orange line corresponds to Eq. (26). The graph shows that for intermediate periods (i.e. between 300 s and 1000 s), the damping by thermal conduction is comparable. However, for shorter or longer periods, the multithermal apparent damping becomes more significant. Caution is appropriate here because the multithermal apparent damping has a Gaussian damping profile that is compared in this graph to the exponential damping profile of the thermal conduction.
 |
Fig. 4. Expected damping lengths (in megameter) as a function of period (in s) for both multithermal apparent damping (Eq. (26)) and thermal conduction (Eq. (3) in Mandal et al. 2016). The density was taken to be 109 cm−3, the mean temperature as 106 K, and the spread in temperature as σv = 26.4 km s−1. |
3. Results: Loops in filter images
3.1. Influence of a finite filter in imaging observations
In this section, we consider the influence of a filter on the observability and multithermal apparent damping of slow waves. For a filter F described by a Gaussian function in vs-space as
 (27)
(27)
with amplitude aF, mean vF, and width σF, the resulting observed signal (equivalent to Eq. (7)) would be
 (28)
(28)
The first two Gaussian distributions may be combined by realising that
 (29)
(29)
where we have introduced the notation
 (30)
(30)
for the width Σ and average V of the resulting Gaussian. This means that the width of the Gaussian is always decreased due to the harmonic average.
These expressions for Σ and V may then be inserted in Eq. (9) while also remembering to also take the extra factors of Eq. (29) along and incorporate them with a. This results in
 (31)
(31)
As before, the damping (following a wave packet at a ray of z = z0 + Vt) has a tendency of
 (32)
(32)
This damping is weaker than in the non-filtered case because Σ < σv.
Likewise, we may also insert Σ and V for σv and  , respectively, in the Gaussian damping lengths (Eq. (26)):
 (33)
(33)
It is also possible to use the propagation speed in different filters to estimate the temperature spread σv and the mean temperature  . This model naturally explains the different propagation speeds in different filter channels, and this difference may be used to measure the loop’s fundamental thermal properties and to quantify its DEM. As in Eq. (30), we observed that σF and vF are known for each filter. Then the propagation speed V may be measured in different filters, allowing us to estimate
  and σv through a least squares fitting.
Moreover, the effective filter width σF is much larger for imaging observations than spectral observations. Thus, it is to be expected that imaging observations are much more profoundly impacted by the effect of multithermal apparent damping. Spectral observations will experience very little damping from the multithermal apparent damping effect given the narrowness of the effective filter. Thus, we may use the combination and contrast between imaging and spectral observations to disentangle the real damping mechanism from the multithermal apparent damping. This approach opens exciting prospects for the seismology of thermal properties of coronal loops.
3.2. Comparison with simulations
In this section, we verify the analytical results described in the previous sections using a 3D MHD multithermal loop model similar to the one presented in Krishna Prasad & Van Doorsselaere (in prep.). Those authors solved the ideal MHD equations with MPI-AMRVAC (Porth et al. 2014), where only numerical diffusion is present and there are no explicit diffusive terms. They considered a bundle of 33 vertical strands with randomly assigned plasma temperatures and densities to represent a coronal loop, similar to the setup we consider in this paper. To elaborate, the plasma temperature T (number density n) for each strand was selected from a random normal distribution whose peak value corresponds to log T = 6.0 (log n = 9.2), with a standard width of 0.15 (0.10). The plasma temperature outside the strands and outside the loop are kept at the same value, 1 MK. The corresponding number densities are fixed at 5 × 108 cm−3. The magnetic field is vertical and parallel to the axis of the loop. For further details on the simulation setup, we refer the interested reader to Krishna Prasad & Van Doorsselaere (in prep.).
By considering the peak (μ log T = 6.0) and the width (σ log T = 0.15) values of the temperature distribution in the simulations and assuming that the resulting distribution of sound speeds is sufficiently normal (so that the theory in Sect. 2 applies), we can estimate the sound speed distribution properties from the temperature distribution. For this purpose, we calculated that log T = 6.0 ± 0.15 corresponds to a sound speed value of  km s−1 by calculating the sound speed for μ log T and μ log T ± σ log T separately. So in what follows, we take the following parameters:
  km s−1 and σv = 26.4 km s−1. Since the period of the driver in the simulation was 180 s, this
  is expected to result in a wavelength of 27.4 Mm. The wavelength values λ obtained in Fig. 5 indicate a good agreement with this.
 |
Fig. 5. Average density (top) and vertical velocity vz (bottom) profiles along the simulated multithermal loop. The solid lines represent a Gaussian damped sinusoid fit to the data following the function given in Eq. (34). The obtained wavelength (λ) and damping length Ld values are listed in the plot. |
In their model, Krishna Prasad & Van Doorsselaere (in prep.) excited slow magneto-acoustic waves within the loop by periodically (period ≈180 s) driving the vertical velocity (vz) at the bottom boundary of the loop with an amplitude of ≈7.6 km s−1, which is approximately 5% of the sound speed at 1 MK. This driving amplitude was chosen to be small because we wanted to avoid any damping caused by non-linear effects of the waves. We used the same driver in this study. However, to highlight the multithermal effects, we restricted the spatial location of the driver to the positions of the strands. In other words, the amplitude of the driver is zero outside the strand locations, and consequently, the oscillations are restricted to the strands. Once the generated slow waves start approaching the top boundary of the loop, we computed the mean density and vertical velocity (vz) across the loop as a function of distance along the loop in order to analyse how the oscillation amplitudes evolve. Figure 5 displays the density and vz profiles along the loop in the top and bottom panels, respectively. As can be seen, the oscillations appear to damp very quickly. For a proper quantitative assessment, we measured the damping lengths by fitting the data with the following damped sinusoid function
 (34)
(34)
Here, z is the coordinate along the loop axis, A0 is the maximum amplitude, Ld is the damping length, λ is the wavelength, ϕ is the initial phase, and b1 and b0 are the appropriate constants. It may be noted that this function describes a Gaussian-damped sine wave similar to that described in Pascoe et al. (2016). Although exponential damping is generally considered for slow waves, as described in Sect. 2.3, the multithermal apparent damping is expected to produce a Gaussian damping that justifies our choice here. The solid light orange lines in Fig. 5 represent the obtained fits to the data. The damping lengths obtained from the fits are 20 ± 0.3 Mm and 21.2 ± 0.3 Mm for the density and vertical velocity, respectively. These values are within 20% of the expected value of 25 Mm (see Sect. 2.3, Eq. (26)), and they are thus a reasonable match. The deviation may be due to (1) the approximation of the full integral (Eq. (15) by Eq. (19)) or (2) the “small” number of strands (only 33) in the simulations of Krishna Prasad & Van Doorsselaere (in prep.), which is insufficient to fully cover the continuous Gaussian DEM modelled in Eq. (15) due to the finite sample size. Because of the chosen small driver amplitude, non-linear effects do not play a role in the damping of these waves. Numerical diffusion could play a role, but we have verified that increasing the numerical resolution has no effect on the measured damping lengths.
For a direct comparison with observations, we also forward modelled the data using the FoMo code (Van Doorsselaere et al. 2016). In particular, we generated synthetic images in the six coronal channels of SDO/AIA, namely, 94 Å; 131 Å; 171 Å; 193 Å; 211 Å; and 335 Å. As described in Krishna Prasad & Van Doorsselaere (in prep.), we added appropriate data noise (following Yuan & Nakariakov 2012) and subsequently built time-distance maps to study the evolution of oscillations along the loop. The oscillations were found only in three channels, 171 Å, 193 Å, and 211 Å. The propagation properties are exactly the same as those found in Krishna Prasad & Van Doorsselaere (in prep.), so we do not discuss them in detail here. However, we highlight one crucial point: Krishna Prasad & Van Doorsselaere (in prep.) found that the forward modelled propagation speeds in the 211 Å and 193 Å filters were very close to each other despite their difference in temperature. Here, we quantitatively explain this phenomena. As can be seen in Table 1, the predicted propagation speeds V are indeed very close to each other for these filters. We propose that the variation of phase speeds in different observational filters (e.g. King et al. 2003) may be quantitatively explained through the proposed formula in Eq. (30). Indeed, that equation shows that the observed phase speed V is influenced by that specific filter’s σF and vF.
Properties of AIA filter response curves.
Next, we focus on the damping properties of the slow waves. Figure 6 displays the spatial intensity profiles at a particular instant along the loop for the three AIA channels. The solid lines in the figure correspond to the fitted profiles following Eq. (34). We note that the fitted curve in AIA 171 has a significant deviation beyond a distance of 40 Mm. Imposing tighter constraints on the fitting function did not improve the results much. However, the larger uncertainty obtained on the corresponding damping length should have incorporated this significant deviation. The resulting associated damping lengths are 31.8 ± 1.3 Mm, 36.8 ± 0.9 Mm, and 34.7 ± 0.9 Mm, for the 171 Å, 193 Å, and 211 Å channels, respectively. Noticeably, these values are different from those obtained for the density and velocity parameters (see Fig. 5). This is due to the temperature response of the observing filter, which also has an influence on this multithermal apparent damping, as described in Sect. 3.1.
 |
Fig. 6. Spatial intensity profiles at a particular instant along the loop obtained from the synthetic data corresponding to the AIA 171 Å, 193 Å, and 211 Å filters. The solid lines represent a Gaussian damped sinusoid fit to the data following the function given in Eq. (34). The obtained wavelength (λ) and damping length Ld values are listed in the plot. |
In order to quantitatively assess the effect of SDO/AIA filters, we fit the temperature response curves (version 9) for each coronal filter with a Gaussian function and estimated their standard width. The temperature response curves and the fitted profiles are plotted in Fig. 7. For the curves with multiple peaks, we chose the peak that is closer to log T = 6.0, which is the characteristic temperature in our simulations. In each of the panels, the dashed line shows the full response curve, the light orange line denotes the fitted segment, and the green line shows the fitted function. The obtained widths σ log T are 0.22 ± 0.01, 0.17 ± 0.00, 0.13 ± 0.00, 0.12 ± 0.01, 0.12 ± 0.01, and 0.31 ± 0.01, for the 94 Å, 131 Å, 171 Å, 193 Å, 211 Å, and 335 Å channels, respectively. These values along with the respective peak locations are listed in Table 1. From these fitted filter curves in log T-space, we computed the corresponding peak propagation speed vF from the sound speed of the fitted peak temperature for each filter. Then, we calculated σF as the average of sound speeds belonging to the peak temperature plus and minus the filter peak width. Thus, we assumed that the filter is symmetric in velocity space. The results of these calculations are listed in Table 1. We subsequently used Eq. (30) to compute Σ and V, and we also list the obtained values in Table 1.
 |
Fig. 7. SDO/AIA temperature response curves for the six coronal channels as listed. In each of the panels, the blue dashed line represents the full response curve, the light orange solid line represents the segment fitted with a Gaussian function, and the green solid line represents the fitted function. The obtained standard widths are listed in the plot. |
For the density, we calculated the predicted damping time with Eq. (26). To predict the damping times observed in the filters, we used the values for Σ and V and inserted them in Eq. (33). The predicted damping values are listed in Table 2, along with the measured damping values from the simulations. The predicted damping times match reasonably well with the modelled damping times (with a maximum deviation of 30%). As before, we think that this deviation between the numerical damping lengths and the predicted damping lengths is due to the finite number of strands comprising the loop in the simulation. Thus, the number of strands is insufficient to fill the entire Gaussian DEM. In essence, there are an insufficient number of Monte Carlo realisations of the strands to completely cover the expected Gaussian DEM distribution.
Gaussian damping lengths in megameter for various quantities.
4. Conclusions and discussion
In this paper, we have considered the apparent damping of slow waves (which we call “multithermal apparent damping” (MAD) or “Voitenko damping”) due to a different propagation speed in coronal loop strands. We have considered a superposition of δ-function impulses, Gaussian pulses, and driven waves. All of these models led to the multithermal apparent damping of slow waves due to observational phase mixing. We should stress that the damping is indeed only apparent and that no wave energy was  dissipated during the production of this paper. This multithermal apparent damping of the slow waves is expected to be stronger than damping by thermal conduction for short periods (less than 200 s) and comparable for longer periods. We found that the case of driven slow waves leads to a predicted Gaussian damping profile, with a predicted damping length LG of

where  is the average sound speed in the loop, σv is the spread in the sound speed, and ω is the frequency. The resulting predicted value of the damping length matches reasonably well with the one found in the simulations of Krishna Prasad & Van Doorsselaere (in prep.). The predicted damping length scales linearly with the period of the wave. This is compatible with the observational synthesis made by Cho et al. (2016), who observed a unified picture of solar and stellar quasi-periodic pulsations with a damping time scaling linearly with the period. Moreover, this different scaling of the multithermal apparent damping time with the period from thermal conduction may explain the difference not only in damping scalings in open-field or closed-field regions (e.g. Krishna Prasad et al. 2014, and follow-up works) but also in different damping regimes at different heights (Gupta 2014). These different damping regimes could then be associated with different levels of multithermal structuring of loops or plumes and the relative importance of thermal conduction damping and multithermal apparent damping.
In the second part of the paper, we considered the effect of a finite filter width in imaging instruments such as SDO/AIA. We found that as an effect of the finite filter, the waves have a different propagation speed V and damping length LG in each filter, which are given by
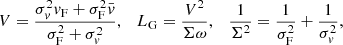
where vF is the central sound speed of the filter and σF is the width of the filter. This explains two phenomena: (1) the dependence of the observed phase speed in different filters on the thermal properties of the loop and (2) the different damping in each filter. We also checked these formulas against the damping in forward models of the simulations of Krishna Prasad & Van Doorsselaere (in prep.). We found that our predictions match reasonably well with the simulated values (within 30%). We suspect that the deviation is mostly caused by the small number of strands in the simulation, in contrast to the continuous DEM distribution that we considered in this paper.
We expect that these results may be used in the future to perform MHD seismology (Nakariakov & Verwichte 2005) of coronal loops with slow waves. With the above formulas, it is possible to fit the loop’s DEM properties of central temperature (through the average sound speed  ) and spread in temperature (through the value of the spread in sound speed σv). These DEM properties of the loop are only sensitive to the loop in which the slow wave propagates. This is in contrast to the currently used method of DEM inversion (e.g. Hannah & Kontar 2012; Cheung et al. 2015; Krishna Prasad et al. 2018), which is very sensitive to the careful background subtraction from the loop’s emission. This proposed method will at least allow for this sensitivity to be removed and perhaps reveal more detailed thermal properties of loops.
In addition, the combination of spectral observations with imaging observations is an interesting avenue to consider because the spectral observations are much less impacted by the multithermal apparent damping, and the combination of this with the imaging observations would allow for the disentangling of physical damping from the multithermal apparent damping.
Several topics can be pursued in future research as follow-up to this work. Some of them would be (1) considering the effect of a combination of multithermal apparent damping and thermal conduction in a multistranded loop system; (2) modelling the effect of multithermal apparent damping on standing sound waves in, for example, flaring loops (Wang 2011; Cho et al. 2016); and (3) investigating of the use of different lines of sight from different spacecraft (e.g. Solar Orbiter and SDO) to probe the inner multithermal structure of loops using multithermal apparent damping properties.
In fact, given their pioneering idea on this, as much as 18 years before this manuscript, we may consider naming the multithermal apparent damping “Voitenko damping” of slow waves.
Acknowledgments
T.V.D. was supported by the European Research Council (ERC) under the European Union’s Horizon 2020 research and innovation programme (grant agreement No. 724326), the C1 grant TRACEspace of Internal Funds KU Leuven, and a Senior Research Project (G088021N) of the FWO Vlaanderen. The research benefited greatly from discussions at ISSI. T.V.D. would like to thank Dipankar Banerjee, Vaibhav Pant and Krishna Prasad for their hospitality when visiting ARIES, Nainital in spring 2023. T.V.D. would like to thank Roberto Soler for referring to the Voitenko et al. (2005) paper at the AGU Chapman conference in Berlin 2023. V.P. is supported by SERB start-up research grant (File no. SRG/2022/001687). A.W.H. acknowledges the financial support of the Science and Technology Facilities Council (STFC) through Consolidated Grants ST/S000402/1 and ST/W001195/1 to the University of St Andrews and support from the European Research Council (ERC) Synergy grant “The Whole Sun” (810218). The computational resources and services used in this work were provided by the VSC (Flemish Supercomputer Center), funded by the Research Foundation Flanders (FWO) and the Flemish Government – department EWI.
References
- Aschwanden, M. J., Nightingale, R. W., & Alexander, D. 2000, ApJ, 541, 1059 [NASA ADS] [CrossRef] [Google Scholar]
- Banerjee, D., Krishna Prasad, S., Pant, V., et al. 2021, Space Sci. Rev., 217, 76 [NASA ADS] [CrossRef] [Google Scholar]
- Berghmans, D., & Clette, F. 1999, Sol. Phys., 186, 207 [Google Scholar]
- Cheung, M. C. M., Boerner, P., Schrijver, C. J., et al. 2015, ApJ, 807, 143 [Google Scholar]
- Cho, I.-H., Cho, K.-S., Nakariakov, V. M., Kim, S., & Kumar, P. 2016, ApJ, 830, 110 [NASA ADS] [CrossRef] [Google Scholar]
- De Moortel, I., & Hood, A. W. 2003, A&A, 408, 755 [NASA ADS] [CrossRef] [EDP Sciences] [Google Scholar]
- De Moortel, I., & Hood, A. W. 2004, A&A, 415, 705 [NASA ADS] [CrossRef] [EDP Sciences] [Google Scholar]
- De Moortel, I., Hood, A. W., Ireland, J., & Walsh, R. W. 2002, Sol. Phys., 209, 89 [NASA ADS] [CrossRef] [Google Scholar]
- De Moortel, I., Antolin, P., & Van Doorsselaere, T. 2015, Sol. Phys., 290, 399 [NASA ADS] [CrossRef] [Google Scholar]
- Geeraerts, M., Vanmechelen, P., Van Doorsselaere, T., & Soler, R. 2022, A&A, 661, A100 [NASA ADS] [CrossRef] [EDP Sciences] [Google Scholar]
- Gupta, G. R. 2014, A&A, 568, A96 [NASA ADS] [CrossRef] [EDP Sciences] [Google Scholar]
- Hannah, I. G., & Kontar, E. P. 2012, A&A, 539, A146 [NASA ADS] [CrossRef] [EDP Sciences] [Google Scholar]
- Hood, A. W., Ruderman, M., Pascoe, D. J., et al. 2013, A&A, 551, A39 [NASA ADS] [CrossRef] [EDP Sciences] [Google Scholar]
- Judge, P. G. 2023, ApJ, 957, 25 [NASA ADS] [CrossRef] [Google Scholar]
- Karampelas, K., & Van Doorsselaere, T. 2018, A&A, 610, L9 [NASA ADS] [CrossRef] [EDP Sciences] [Google Scholar]
- Kiddie, G., De Moortel, I., Del Zanna, G., McIntosh, S. W., & Whittaker, I. 2012, Sol. Phys., 279, 427 [NASA ADS] [CrossRef] [Google Scholar]
- King, D. B., Nakariakov, V. M., Deluca, E. E., Golub, L., & McClements, K. G. 2003, A&A, 404, L1 [NASA ADS] [CrossRef] [EDP Sciences] [Google Scholar]
- Kolotkov, D. Y., Nakariakov, V. M., & Zavershinskii, D. I. 2019, A&A, 628, A133 [NASA ADS] [CrossRef] [EDP Sciences] [Google Scholar]
- Krishna Prasad, S., Banerjee, D., Van Doorsselaere, T., & Singh, J. 2012, A&A, 546, A50 [NASA ADS] [CrossRef] [EDP Sciences] [Google Scholar]
- Krishna Prasad, S., Banerjee, D., & Van Doorsselaere, T. 2014, ApJ, 789, 118 [Google Scholar]
- Krishna Prasad, S., Jess, D. B., Van Doorsselaere, T., et al. 2017, ApJ, 847, 5 [Google Scholar]
- Krishna Prasad, S., Raes, J. O., Van Doorsselaere, T., Magyar, N., & Jess, D. B. 2018, ApJ, 868, 149 [Google Scholar]
- Krishna Prasad, S., Jess, D. B., & Van Doorsselaere, T. 2019, Front. Astron. Space Sci., 6, 57 [NASA ADS] [CrossRef] [Google Scholar]
- Magyar, N., & Van Doorsselaere, T. 2016, ApJ, 823, 82 [CrossRef] [Google Scholar]
- Mandal, S., Magyar, N., Yuan, D., Van Doorsselaere, T., & Banerjee, D. 2016, ApJ, 820, 13 [Google Scholar]
- Mandal, S., Krishna Prasad, S., & Banerjee, D. 2018, ApJ, 853, 134 [NASA ADS] [CrossRef] [Google Scholar]
- Nakariakov, V. M., & Verwichte, E. 2005, Liv. Rev. Sol. Phys., 2, 3 [Google Scholar]
- Pascoe, D. J., Hood, A. W., de Moortel, I., & Wright, A. N. 2012, A&A, 539, A37 [NASA ADS] [CrossRef] [EDP Sciences] [Google Scholar]
- Pascoe, D. J., Goddard, C. R., Nisticò, G., Anfinogentov, S., & Nakariakov, V. M. 2016, A&A, 585, L6 [NASA ADS] [CrossRef] [EDP Sciences] [Google Scholar]
- Pascoe, D. J., Anfinogentov, S., Nisticò, G., Goddard, C. R., & Nakariakov, V. M. 2017, A&A, 600, A78 [NASA ADS] [CrossRef] [EDP Sciences] [Google Scholar]
- Pascoe, D. J., Van Doorsselaere, T., & De Moortel, I. 2022, ApJ, 929, 101 [NASA ADS] [CrossRef] [Google Scholar]
- Porth, O., Xia, C., Hendrix, T., Moschou, S. P., & Keppens, R. 2014, ApJS, 214, 4 [Google Scholar]
- Shi, M., Van Doorsselaere, T., Guo, M., et al. 2021, ApJ, 908, 233 [Google Scholar]
- Uritsky, V. M., Davila, J. M., Viall, N. M., & Ofman, L. 2013, ApJ, 778, 26 [NASA ADS] [CrossRef] [Google Scholar]
- Van Doorsselaere, T., Antolin, P., Yuan, D., Reznikova, V., & Magyar, N. 2016, Front. Astron. Space Sci., 3 [CrossRef] [Google Scholar]
- Van Doorsselaere, T., Antolin, P., & Karampelas, K. 2018, A&A, 620, A65 [NASA ADS] [CrossRef] [EDP Sciences] [Google Scholar]
- Van Doorsselaere, T., Srivastava, A. K., Antolin, P., et al. 2020, Space Sci. Rev., 216, 140 [Google Scholar]
- Voitenko, Y., Andries, J., Copil, P. D., & Goossens, M. 2005, A&A, 437, L47 [NASA ADS] [CrossRef] [EDP Sciences] [Google Scholar]
- Wang, T. 2011, Space Sci. Rev., 158, 397 [Google Scholar]
- Wang, T., & Ofman, L. 2019, ApJ, 886, 2 [Google Scholar]
- Wang, T., Ofman, L., Sun, X., Provornikova, E., & Davila, J. M. 2015, ApJ, 811, L13 [NASA ADS] [CrossRef] [Google Scholar]
- Williams, T., Walsh, R. W., Regnier, S., & Johnston, C. D. 2021, Sol. Phys., 296, 102 [CrossRef] [Google Scholar]
- Yu, D. J., Van Doorsselaere, T., & Goossens, M. 2017a, A&A, 602, A108 [NASA ADS] [CrossRef] [EDP Sciences] [Google Scholar]
- Yu, D. J., Van Doorsselaere, T., & Goossens, M. 2017b, ApJ, 850, 44 [Google Scholar]
- Yuan, D., & Nakariakov, V. M. 2012, A&A, 543, A9 [NASA ADS] [CrossRef] [EDP Sciences] [Google Scholar]
All Tables
All Figures
|
Fig. 1. Schematic representation of the considered configuration. Three magnetic strands are shown. The cyan Gaussian pulses are excited at time t = 0 at z = z0 on all strands simultaneously. On each strand, the pulses propagate at a different speed, first to the blue line and then the purple line. The resultant observed intensity, as integrated over the different strands, is given by the red line, which shows the multithermal apparent damping and broadening. |
| In the text | |
|
Fig. 2. Comparison of Monte Carlo simulation with the analytical result. The analytically predicted envelope (Eq. (10)) is drawn with a dark blue line. The progressive evolution in time of the Monte Carlo wave packet is indicated with the light blue to purple colour. The mean sound speed was taken as |
| In the text | |
|
Fig. 3. Comparison of Monte Carlo simulation of driven sine functions (blue line) with the full integral (light orange) and the approximations in Eq. (19) (green). All functions have been normalised to the starting value of one. The expected Gaussian damping envelope (Eq. (26)) is shown in red. The time was arbitrarily chosen to be t = 0, and the mean sound speed 152 km s−1 and spread in sound speed σv = 26.4 km s−1 were chosen as before. |
| In the text | |
|
Fig. 4. Expected damping lengths (in megameter) as a function of period (in s) for both multithermal apparent damping (Eq. (26)) and thermal conduction (Eq. (3) in Mandal et al. 2016). The density was taken to be 109 cm−3, the mean temperature as 106 K, and the spread in temperature as σv = 26.4 km s−1. |
| In the text | |
|
Fig. 5. Average density (top) and vertical velocity vz (bottom) profiles along the simulated multithermal loop. The solid lines represent a Gaussian damped sinusoid fit to the data following the function given in Eq. (34). The obtained wavelength (λ) and damping length Ld values are listed in the plot. |
| In the text | |
|
Fig. 6. Spatial intensity profiles at a particular instant along the loop obtained from the synthetic data corresponding to the AIA 171 Å, 193 Å, and 211 Å filters. The solid lines represent a Gaussian damped sinusoid fit to the data following the function given in Eq. (34). The obtained wavelength (λ) and damping length Ld values are listed in the plot. |
| In the text | |
|
Fig. 7. SDO/AIA temperature response curves for the six coronal channels as listed. In each of the panels, the blue dashed line represents the full response curve, the light orange solid line represents the segment fitted with a Gaussian function, and the green solid line represents the fitted function. The obtained standard widths are listed in the plot. |
| In the text | |
Current usage metrics show cumulative count of Article Views (full-text article views including HTML views, PDF and ePub downloads, according to the available data) and Abstracts Views on Vision4Press platform.
Data correspond to usage on the plateform after 2015. The current usage metrics is available 48-96 hours after online publication and is updated daily on week days.
Initial download of the metrics may take a while.