Fig. 2.
Download original image
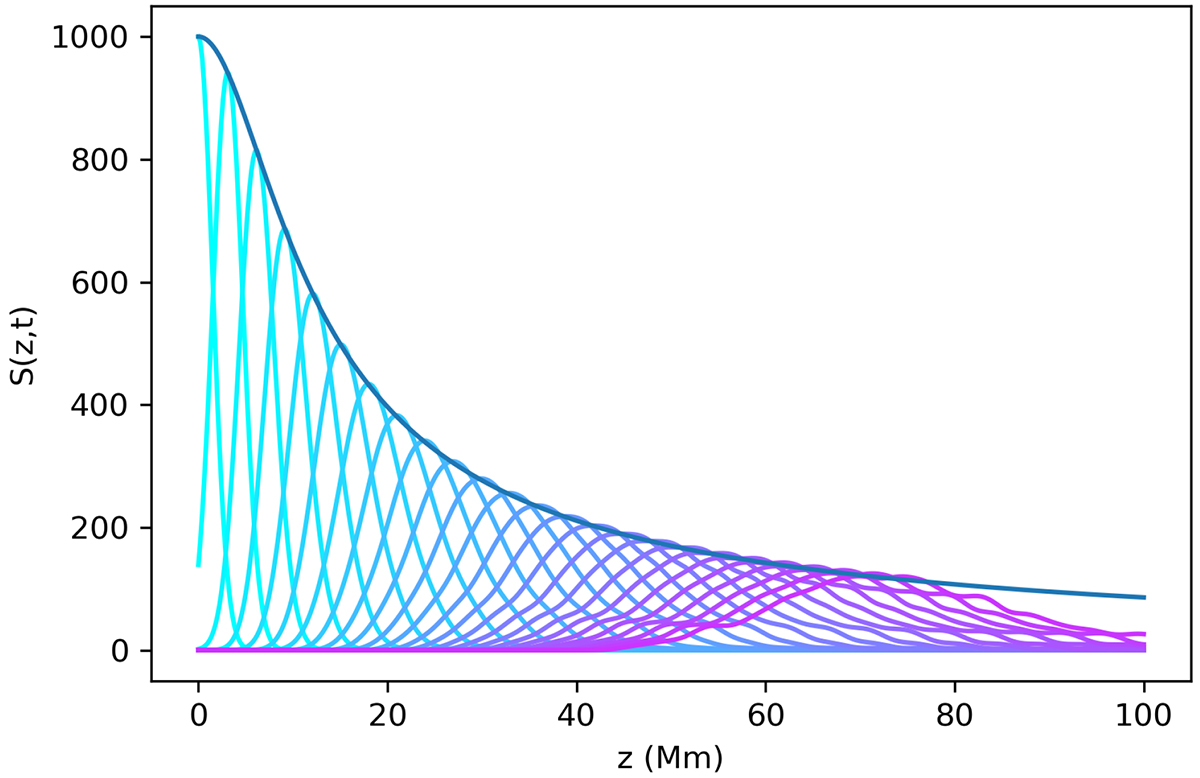
Comparison of Monte Carlo simulation with the analytical result. The analytically predicted envelope (Eq. (10)) is drawn with a dark blue line. The progressive evolution in time of the Monte Carlo wave packet is indicated with the light blue to purple colour. The mean sound speed was taken as ![]() km s−1 and the spread in sound speed as σv = 26.4 km s−1.
km s−1 and the spread in sound speed as σv = 26.4 km s−1.
Current usage metrics show cumulative count of Article Views (full-text article views including HTML views, PDF and ePub downloads, according to the available data) and Abstracts Views on Vision4Press platform.
Data correspond to usage on the plateform after 2015. The current usage metrics is available 48-96 hours after online publication and is updated daily on week days.
Initial download of the metrics may take a while.