Fig. 1.
Download original image
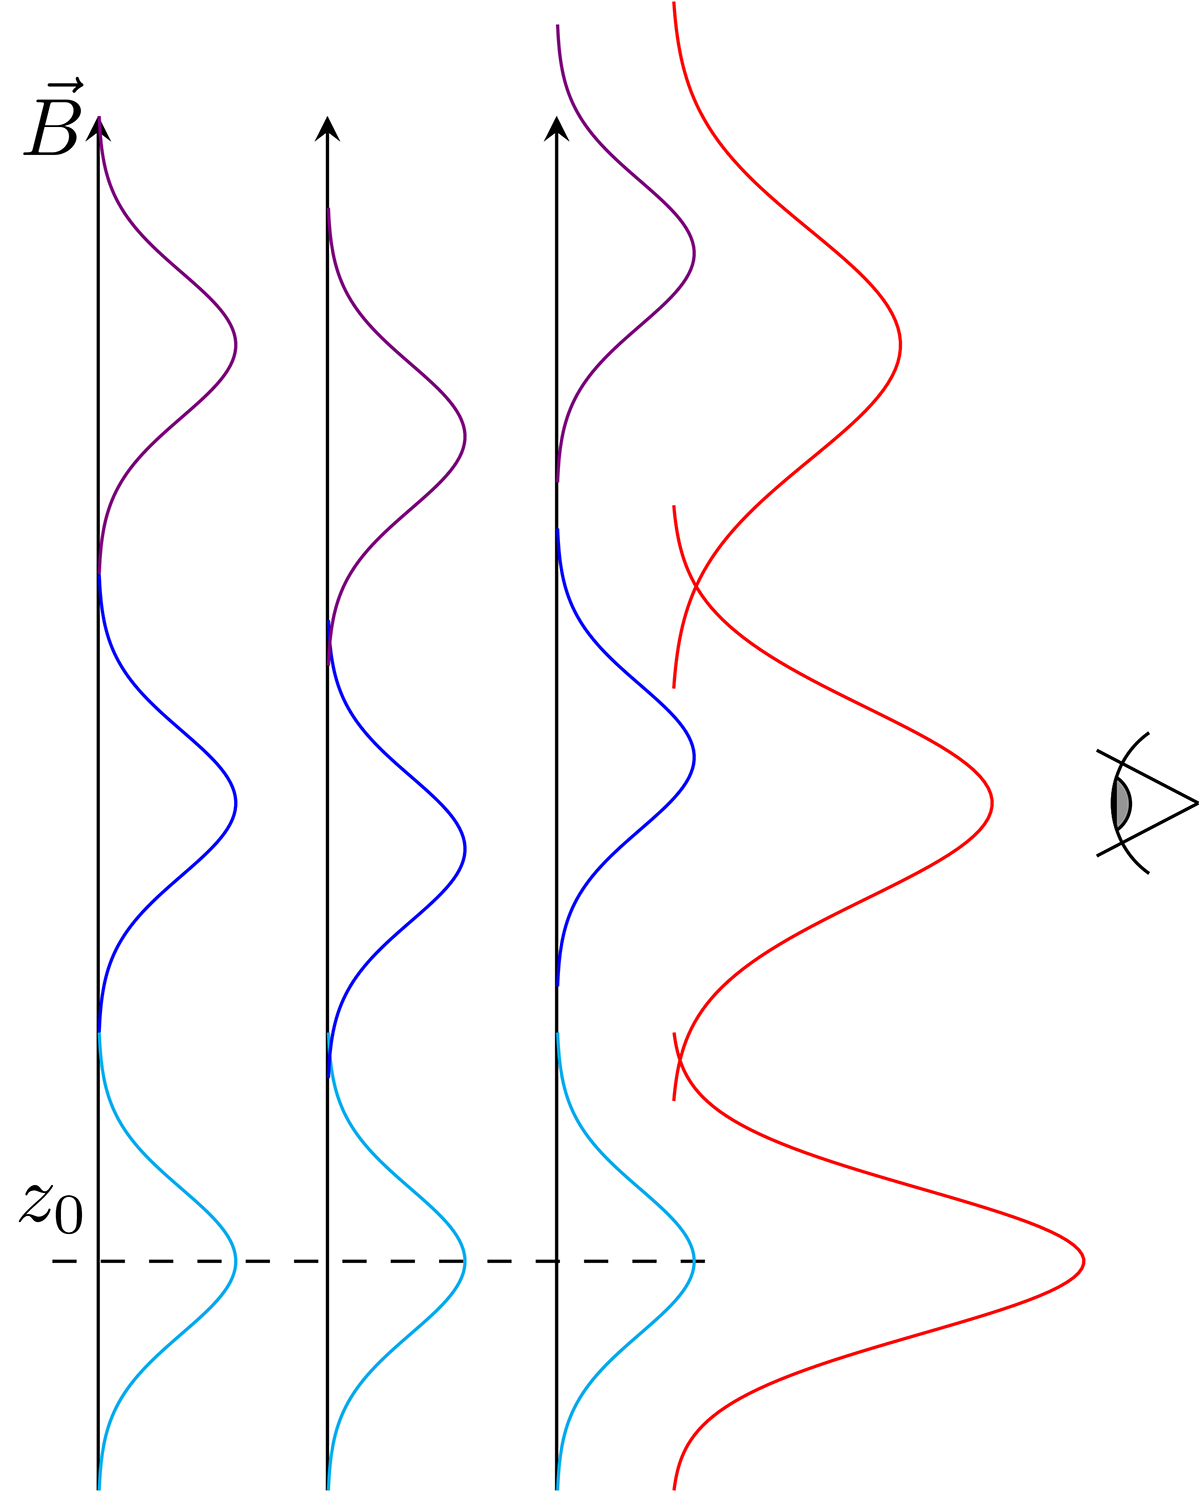
Schematic representation of the considered configuration. Three magnetic strands are shown. The cyan Gaussian pulses are excited at time t = 0 at z = z0 on all strands simultaneously. On each strand, the pulses propagate at a different speed, first to the blue line and then the purple line. The resultant observed intensity, as integrated over the different strands, is given by the red line, which shows the multithermal apparent damping and broadening.
Current usage metrics show cumulative count of Article Views (full-text article views including HTML views, PDF and ePub downloads, according to the available data) and Abstracts Views on Vision4Press platform.
Data correspond to usage on the plateform after 2015. The current usage metrics is available 48-96 hours after online publication and is updated daily on week days.
Initial download of the metrics may take a while.