| Issue |
A&A
Volume 683, March 2024
|
|
|---|---|---|
| Article Number | A47 | |
| Number of page(s) | 19 | |
| Section | Extragalactic astronomy | |
| DOI | https://doi.org/10.1051/0004-6361/202347446 | |
| Published online | 06 March 2024 | |
Galactoseismology in cosmological simulations
Vertical perturbations by dark matter, satellite galaxies, and gas⋆
1
Dpto. de Física de la Tierra y Astrofísica, Fac. CC. Físicas, Universidad Complutense de Madrid, Plaza de las Ciencias 1, 28040 Madrid, Spain
e-mail: This email address is being protected from spambots. You need JavaScript enabled to view it.
2
Institut de Ciències del Cosmos (ICCUB), Universitat de Barcelona (UB), c. Martí i Franquès 1, 08028 Barcelona, Spain
3
Departament de Física Quàntica i Astrofísica (FQA), Universitat de Barcelona (UB), c. Martí i Franquès 1, 08028 Barcelona, Spain
4
Institut d’Estudis Espacials de Catalunya (IEEC), c. Gran Capità 2-4, 08034 Barcelona, Spain
5
Lund Observatory, Division of Astrophysics, Department of Physics, Lund University, Box 43 221 00 Lund, Sweden
6
Instituto Multidisciplinar de Investigación y Postgrado, Universidad de La Serena, Raúl Bitrán 1305, La Serena, Chile
7
Departamento de Astronomía, Universidad de La Serena, Av. Juan Cisternas 1200 Norte, La Serena, Chile
8
National Astronomical Observatory of Japan, Mitaka-shi, Tokyo 181-8588, Japan
9
Center for Computational Astrophysics, Flatiron Institute, 162 Fifth Ave, New York, NY 10010, USA
10
Instituto de Física de Partículas y del Cosmos (IPARCOS), Universidad Complutense de Madrid, 28040 Madrid, Spain
Received:
12
July
2023
Accepted:
8
November
2023
Abstract
Context. Complex models recently became available for studying the dynamics of disk galaxies such as the Milky Way (MW). These models include the global dynamics from dwarf satellite galaxies, dark matter halo structure, gas infall, and stellar disks in a cosmological context.
Aims. We use a MW model from a suite of high-resolution hydrodynamical cosmological simulations named GARROTXA to establish the relationship between the vertical disturbances seen in its galactic disk and multiple perturbations from the dark matter halo, satellites, and gas.
Methods. We calculated the bending modes in the galactic disk in the last 6 Gyr of evolution. We computed the vertical acceleration exerted by dark matter and gas in order to quantify the impact of these components on the disk, and compared this with the bending behavior with Fourier analysis.
Results. We find complex bending patterns at different radii and times, such as an inner retrograde mode with high frequency and an outer slower retrograde mode excited at different times. The amplitudes of these bending modes are highest during the early stages of formation of the thin disk (20 km s−1) and reach up to 8.5 km s−1 in the late disk evolution. We find that the infall of satellite galaxies leads to a tilt of the disk, and produces strong anisotropic gas accretion with a misalignment of 8° with subsequent star formation events and supernovae, creating significant vertical accelerations on the disk plane. The misalignment between the disk and the inner stellar and dark matter triaxial structure, which formed during the ancient assembly of the galaxy, also leads to a strong vertical acceleration of the stars. We also find dark matter subhalos that temporally coincide with the appearance of bending waves in certain periods.
Conclusions. We conclude that several agents trigger the bending of the stellar disk and its phase spirals in this simulation, including satellite galaxies, dark subhalos, misaligned gaseous structures, and the inner dark matter profile. These phenomena coexist and influence each other, sometimes making it challenging to establish direct causality.
Key words: methods: numerical / stars: kinematics and dynamics / Galaxy: kinematics and dynamics / galaxies: evolution
The data underlying this article will be shared with corresponding authors upon reasonable request.
© The Authors 2024
 Open Access article, published by EDP Sciences, under the terms of the Creative Commons Attribution License (https://creativecommons.org/licenses/by/4.0), which permits unrestricted use, distribution, and reproduction in any medium, provided the original work is properly cited.
This article is published in open access under the Subscribe to Open model. This email address is being protected from spambots. You need JavaScript enabled to view it. to support open access publication.
1. Introduction
The stars of the Milky Way (MW) disk appear to be vertically disturbed. These perturbations can be detected in the stellar density distribution of structures such as the warp, corrugations, and north–south asymmetries (Widrow et al. 2012; Williams et al. 2013; Schönrich & Dehnen 2018). More recently, using high-quality data for stars in the solar neighbourhood obtained by the Gaia satellite (Gaia Collaboration 2018; Brown et al. 2021), Antoja et al. (2018) found a new structure in the phase space: the phase spiral. This structure is the result of a perturbation of the disk (external or internal), which vertically displaces stars and triggers a phase-mixing process. In attempts to explain its origin, the focus has been on the Sagittarius dwarf galaxy, which is a known recent perturber of the MW (Binney & Schönrich 2018; Laporte et al. 2019; Bland-Hawthorn et al. 2019; Li & Shen 2020; Bland-Hawthorn & Tepper-García 2021; Hunt et al. 2021; Gandhi et al. 2022; Widmark et al. 2021). Recent observations show that the formation mechanism of the phase spiral is more complex than initially expected (Hunt et al. 2022; Antoja et al. 2023; Alinder et al. 2023; Frankel et al. 2023). These structures in the vertical phase space are products of the perturbations of the stellar disk, which can be seen as deformations of both the kinematics and positions with respect to the Galactic plane. These deformations can also be detected as bending waves. This bending behavior has also been detected in other galaxies (Gómez et al. 2021; Nandakumar et al. 2022; Urrejola-Mora et al. 2022).
Several theoretical studies using N-body and analytical models have attributed vertical perturbations to interactions with satellites (e.g. Gómez et al. 2013; Debattista 2014; de la Vega et al. 2015; D’Onghia et al. 2016; Laporte et al. 2018; Semczuk et al. 2020; Bennett & Bovy 2021), the dark matter wake – as a consequence of the interaction between the halo and an external perturber – (Weinberg 1998; Gómez et al. 2016; Laporte et al. 2018; Grand et al. 2023), and to interactions with dark matter subhalos (Feldmann & Spolyar 2015; Chequers et al. 2018; Tremaine et al. 2023). These satellites may also perturb the gaseous disk and have an impact on its evolution (Chakrabarti & Blitz 2009, 2011). Other amplification mechanisms of the vertical perturbations of the disk include gas infall along warps (Khachaturyants et al. 2022) and misalignment of the plane of stars at different radii (Sellwood & Debattista 2022). Thus, vertically disturbed stars can have a diverse range of origins and a perturbed disk may be a common state throughout galactic disks.
Grion Filho et al. (2021) used a purely gravitational N-body simulation to calculate the accelerations produced by the disk, by the Sagittarius-like dwarf galaxy, and by dark matter halos in order to discern the dominant source of perturbation in the different parts of the disk and at different moments of evolution. These authors found that there are moments when the response of the dark matter halo to the passing of the satellite enhances the effect of the latter. However, to have a complete picture of the dynamical mechanisms taking place in the Galaxy, the hydrodynamical processes must be included. Cosmological hydrodynamical simulations take into account realistic satellite accretion onto the host galaxy and therefore multiple satellites can perturb the disk, whereas isolated N-body models only account for one perturbing satellite interacting with the disk. However, multiple satellites can lead to different effects when interacting with the disk and with each other (Rocha et al. 2012; Widrow et al. 2014; D’Onghia et al. 2016; Trelles et al. 2022). Gómez et al. (2017) used cosmological simulations to study vertical patterns in galactic disks. These authors found that approximately 70% of the simulated galaxies show clear vertical patterns produced by close satellite encounters, distant flybys of massive companions, accretion of misaligned cold gas, and reaccretion of cold gas from the progenitors of gas-rich major mergers. However, the spatial resolution of the simulation does not allow scales of the size of the solar neighborhood to be studied. van de Voort et al. (2015) used a cosmological model to follow the evolution of highly misaligned gas, where the inner parts of the galaxy realign with this gas more quickly, resulting in a warp at later times of evolution. Semczuk et al. (2020) used galactic disks from the IllustrisTNG cosmological simulation to study tidally induced warps, finding that both satellite interaction and gas accretion may induce warps.
In our previous work (García-Conde et al. 2022; GC22 hereafter), we found phase spirals in a MW-like disk for the first time in a cosmological simulation that we call the GARROTXA (Roca-Fàbrega et al. 2016) model. However, the exact origin of these phase spirals was not clear, because the satellites in this model are less massive (∼109 M⊙ at the moment of the pericenter) than the minimum mass required to excite phase spirals – as reported in the literature –, at least in the context of the Sagittarius dwarf galaxy and the MW. For example, the models by Laporte et al. (2019) and Bland-Hawthorn & Tepper-García (2021) used masses of 6 × 10¹⁰ and 2 × 10¹⁰ M⊙, respectively. We suggested that other effects could generate strong perturbations in the disk, such as the interaction of the collective effects of several satellites, or the misalignment of the angular momentum of the different components of the simulation, especially the stellar disk and dark matter halo, or a combination of these phenomena. Later on, Grand et al. (2023) used a high-resolution simulation of a MW-like galaxy from the Auriga suite of cosmological simulations and resolved phase spirals in the disk. The main formation mechanism of the phase spiral in this latter simulation was found to be the dark matter halo response to the passage of a satellite galaxy. As opposed to our case, these authors assumed a dominant source of perturbation, and were therefore able to identify the main cause of the triggering of the phase spiral.
Here, we further analyze the vertical behavior of the disk of the GARROTXA model. In this work, we identify bending modes (as calculated in Widrow et al. 2014) and study their behavior using Fourier decomposition. We calculate the vertical acceleration of the dark matter particles onto the disk and its relation with the passing satellites and the inner structure of the halo itself. We also analyze the vertical gravitational acceleration applied by the gas to understand the relationship between its misalignment with respect to the disk. Thus, we present a more realistic picture of the satellites, halos, gas, and disk interactions.
In this paper, we start in Sect. 2 by describing the simulation and its different structures. In Sect. 3 we describe the behavior of the disk and quantify its disturbances, focusing on the vertical component. In Sect. 4 we calculate the vertical accelerations (aZ) applied by dark matter and gas onto the disk and identify all satellites in the system. In Sect. 5 we link the measured bending modes and disk tilting to the different typology of interactions occurring in our model, characterized in the previous sections, and we find many intertwined agents to be involved in the bending of the disk. In Sect. 6, we discuss our results and present our conclusions.
2. The GARROTXA simulation
In this work, we use model G.323 of the GARROTXA simulation (Roca-Fàbrega et al. 2016), which is similar (although at the lower end of the predicted virial mass range) to the MW in terms of disk size and rotation curve. The spatial resolution of this model is 109 pc, with a minimum dark matter particle mass of 105 M⊙, a typical mass of disk stellar particles of 3.5 × 10³ M⊙, and a minimum time-step of 103 yr. At z ∼ 0, we have ∼2 × 10⁶ stellar particles within the virial radius. The summary of these characteristics is shown in Table 1.
Main characteristics of the MW-sized model G.323 of GARROTXA simulation at z = 0.
The analysis presented here focuses on data encompassing the last 6.3 Gyr (from 6.3 Gyr in lookback time to the present, equivalent to scale factors of a = 0.6 to a = 1.0, respectively) of the evolution of the simulated galactic system. This is the period where we find a well-defined stellar disk. In this period, we have 190 snapshots available. This allows us to undertake an exhaustive temporal evolution study of the disks kinematics and density structures. To read and analyze the simulation we use the software yt (Turk et al. 2011).
The main dark matter structures of this model at the mentioned period are a halo with a virial radius Rvir = 154 kpc1 and a total mass of 6.5 ×10¹¹ M⊙. The inner parts of the dark matter halo are dominated by a central triaxial substructure with an ellipsoidal shape extending to approximately 10 kpc in its major axis and 5 kpc in its minor axis. This structure was formed at z ∼ 3 (11.6 Gyr in lookback time) as a result of a 1:1 major merger (Roca-Fàbrega et al. 2016). The oldest stellar particles, both belonging to the primordial galaxies (pre-merger) and born during this major merger, show properties similar to those of an old elliptical galaxy embedded in a triaxial dark matter halo, which is not rotationally supported. After this 1:1 major merger, a new stellar disk starts to form but is perturbed by another merger, which is the last major merger of the galactic system studied here. This last major merger occurs at z ∼ 1.5 (∼1:10 merger at 9.55 Gyr of lookback time) and sets the more recent components of the structure of the galaxy, that is, an old, thick stellar disk and a much younger, thin stellar disk.
At each snapshot, we apply a centering and alignment of the main galactic system. The center of mass is calculated iteratively in spheres of shrinking radii, as in Power et al. (2003). After this centering, we compute the disk plane by calculating the angular momentum of stars inside a 20% of Rvir, and we then apply a change of basis to align this with the Z axis. This places most of the galactic disk in a plane oriented with Z = 0. The X-axis is the projection of the original X-axis from the cosmological box onto the galactic plane, whose normal vector is L. We then take all stellar particles born after z ∼ 1.5 inside a fixed cylindrical section with Z < |3| and R < 7 kpc and apply the same process, which further aligns the L of the inner galaxy with the Z axis.
We use galactocentric cylindrical coordinates (R, ϕ, Z) where ϕ and Vϕ are negative in the direction of rotation. The direction of ϕ = 0 is oriented towards the positive X axis.
Figure 1 shows the different structures of the stellar component of the model at the present time (z = 0) in its edge-on and face-on projections (top and central rows, respectively) and the face-on view, which is colored by age (bottom panels). We separate stellar particles depending on whether they were born after (left column) or before the last major merger mentioned above (middle and right columns). In practice, we take a time of 9.05 Gyr (i.e., 500 Myr after the merger) to ensure that we are selecting the particles born in the young, thin stellar disk.
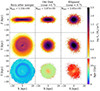 |
Fig. 1. Different structures of the stellar component of the snapshot at the present time z = 0. The left panel shows stars born 500 Myr after the last major merger (at 9.55 Gyr in lookback time). The panels in the central column show the older, hot disk. Finally, in the right column, we show the old stellar ellipsoid. The top two rows show the surface density of the stellar particles in the X–Z and X–Y projections, respectively. The last row shows the face-on projection colored by age. The disk rotates clockwise in this reference system. |
The stellar particles born before the merger are distributed in the above-mentioned ellipsoid (right column) akin to that dominating the inner dark matter halo, and a structure that is today composed of an old, dynamically hot disk (central column). To separate this old disk from the ellipsoid, we calculate the angle α between the vector of Z = 0 plane and the angular momentum of the stars, considering stars with cos(α) < 0.7 as part of the ellipsoid.
For our study, we use only particles born after the last major merger, thus belonging to the “young” disk (left panels), to track any signs of vertical perturbation. In the inner galactic regions (< 5 kpc), there is an oval structure whose major axis is oriented at the same angle at all times and has an A2/A0 average amplitude of 0.35. This elongated structure has a quadrupole signal in the velocity VR, but as we do not detect a pattern speed, we do not consider it to be a bar. This structure contains stellar particles of the same age as the disk. The semi-major axis of this young elongated structure is oriented in the same way as the minor axis of the old stellar and dark matter inner triaxial structure. There is also a one-armed structure, or lopsided mode, in the young stellar disk component. We return to this aspect in Appendix B, although for this study we focus mostly on the vertical disturbances. Finally, for the following analyses, we further select stellar particles with |Z|< 2.5 kpc and R < 25 kpc, similar to GC22. In summary, in this study, we select particles from the disk based on their age (born after 9 Gyr in lookback time) and location (aforementioned region). After this selection, we end up with ∼1.39 × 10⁶ stellar particles in the disk.
3. Vertical bending modes of the disk
In this section, we focus on the Z and VZ distributions of the disk through its bending modes, similarly to Widrow et al. (2014), as a way to quantify the vertical deformation of the disk. These modes can lead to phase spirals (Bland-Hawthorn & Tepper-García 2021; Darling & Widrow 2019), and therefore an additional motivation is our desire to be able to explain the phase spirals found in GC22. By identifying the timing and spatial location of the perturbations, we hope to establish a link with the underlying phenomenon – whether internal or external – that causes this deformation.
To calculate the vertical modes, we divide the X − Y plane into 70 bins from −25 to 25 kpc in both coordinates X and Y (bin size of ≈0.7 kpc). This binning allows us to have a sufficient number of stellar particles (an average of 350 particles per bin) to perform the following calculations. In each bin, we calculate the linear regression of VZ as a function of Z. The slope and the intercept correspond to the amplitudes of the breathing (A) and bending (B) amplitude respectively:
 (1)
(1)
An example of this method can be seen in Fig. 2, where we show the face-on projection of the galactic disk at two different lookback times of evolution, corresponding to 2.33 Gyr (left columns) and 0.99 Gyr (right columns). We show an overdensity plot of the disk particles with a Gaussian filter (top panels), as well as the bending (middle panels) and breathing (bottom panels) amplitudes of the young disk computed with Eq. (1). In the top panels, we can see a one-armed density structure, which is leading and retrograde. In the central panels, we show how strong bending waves appear at specific times while they can be weaker in others (right vs. left panels). In the breathing modes (bottom panels), we see a prominent mode m = 2, which follows the oval structure at the inner parts of the stellar disk, and is present all through the recent galaxy evolution. This is consistent with previous studies, where this breathing behavior is linked to the bar or other nonaxisymmetric internal structures (Widrow et al. 2014; Faure et al. 2014; Monari et al. 2015).
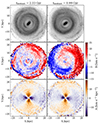 |
Fig. 2. Overdensity plot of the disk particles with a Gaussian filter σ = 6 (top panel), bending (middle), and breathing (bottom) maps at two different snapshots of this simulation in each column, 2.33 Gyr and 0.99 Gyr in lookback time. A strong bending mode can be seen at 0.99 Gyr (middle right panel). |
Here, we mostly focus on the bending modes, while the breathing modes and their relation to the density patterns (i.e., the central oval structure and the retrograde one-armed pattern) are briefly examined in Appendix B for the sake of completeness.
To visualize the evolution of the bending parameters over time, we take the values of B in the X–Y grid and apply a Fourier analysis that we evaluate in a polar grid, dividing the disk into radial sections of 1 kpc in width. For each ring, we have N bins from the initial X–Y grid, each of which is located in an azimuthal position ϕi, and has a bending amplitude (weight in the Fourier decomposition) of Wi = Bi. We then perform a Fourier decomposition following the next expression2:
 (2)
(2)
We estimated the amplitudes for each mode, Am, at each radius and time. We focus on the results for m = 1 and m = 2 in the rest of the analysis. We also analyzed higher modes, but, even though at sometimes they are comparable with the amplitudes of modes m = 1 and m = 2, they are never dominant. We also study the phase at which the maximum amplitude for each mode is located at each radius, following the expression:
 (3)
(3)
Figure 3 shows the amplitude and phases of the bending modes m = 1 (left panels) and m = 2 (right panels) as a function of radius and time. The bending pattern seems to be very complex. Over the studied time span, at R > 7, there is an overall dominance of red-black colors (corresponding to a phase of 0–100°), indicating that the bending is prone to excitation at this angle. At the beginning of the evolution (between 6.3 and 5 Gyr), there is a highly perturbed disk, as indicated by the higher amplitudes of the bending modes (top row of panels), which can be up to 20 km s−1 at external radii. At these times, the phase of this bending mode m = 1 (bottom left panel) at radii R > 7 shows a slow retrograde pattern ( in our reference system). From 2 Gyr to the present, we see that the amplitude of the bending mode m = 1 increases, with the phase oriented as in previous times, reaching its maximum at approximately 1.1 Gyr, with a value of 7.5 km s−1 between 10 and 15 kpc, and 8.5 km s−1 between 15 and 20 kpc with a leading shape.
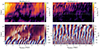 |
Fig. 3. Temporal evolution of the Fourier amplitude Am of the bending modes (top panels) and phase ϕm (bottom panels) of the m = 1 (left panels) and m = 2 (right panels) modes. The phase of mode m = 2 ranges between −90° and 90° because of the duplicity of the structures. The white horizontal dashed lines mark the division of the disk at radii of 10 and 20 kpc. The bending m = 1 dominates over m = 2 and shows higher amplitudes at outer radii (R > 7 kpc) excited mainly at the beginning of the studied time span and at later times from 2 Gyr onward. The inner parts show faster retrograde bending waves with the highest amplitude happening around 4 Gyr of lookback time. |
At inner radii (< 7 kpc), we generally see a fast retrograde pattern ( , in the bottom left panel) that is excited at certain times (top left panel). We observe that its amplitude is maximum at 3.5 Gyr (with 3.5 km s−1 of amplitude).
The m = 2 mode of the bending shows high amplitudes at earlier times (top left panel), and generally at higher radii, has prograde motion ( ). From 2.5 Gyr to 1.8 Gyr, we see an increase at intermediate regions of the disk, although the bending mode m = 1 generally dominates at these times and radii (we further discuss the behavior of the bending mode amplitudes in Sect. 6).
4. Perturbation agents: Dark matter, satellite galaxies, and gas
To quantify the impact that the dark matter and gas have on the vertical direction of the disk, we calculated the vertical gravitational accelerations aZ that they produce on the galactic disk, which is on the Z = 0 plane at every snapshot (see Sect. 2). This is computationally faster than calculating accelerations on all disk particles. This mesh has 100 × 100 bins in the X and Y directions and extends to R = 40 kpc. We used the following expression:
 (4)
(4)
where the vertical acceleration at each bin (az, bin) is the sum of all individual vertical accelerations from all the mass elements Npart (dark matter particles or gas cell) of each component (dark matter and gas). mi is the mass of each mass element, and ri, bin is the total distance between the bin and the mass element. The relation rz; i, bin/ri, bin takes the vertical component of the acceleration.
Some mass elements can be very close to the Z = 0 plane, producing large accelerations, and increasing the noise in the Fourier analysis. To mitigate this, we establish a limit of maximum acceleration in a bin, corresponding to the acceleration that an element can apply if it is situated at a vertical distance of ±54 pc from the plane, which is half of the minimum size of the gas cell (equivalent to the spatial resolution of the simulation: 109 pc). If an acceleration in a bin exceeds this limit, it is set to this maximum.
Figure 4 shows aZ in the Z = 0 plane at two different time periods (three leftmost panels vs. the three rightmost) coinciding with two instances when at least one of the satellites is near its pericenter. In the top row, we show the acceleration by the dark matter particles, where we can see the effects of the satellite crossing the plane between the first panel (negative Z, negative vertical accelerations) and the next one (positive Z, positive vertical accelerations). The three rightmost panels show another interaction, but in this case, the satellite is not crossing the plane at the moment of minimum distance. However, we can see the vertical accelerations it induces in the outer parts of the grid (upper right regions in red), which are outside of the disk.
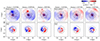 |
Fig. 4. Vertical acceleration of dark matter (top panels) and gas (bottom panels). Black dot-dashed circles are situated at 20 kpc, illustrating the size of the stellar disk of the galaxy. The dark matter acceleration in the top three leftmost panels is dominated by the crossing of dark matter subhalos DM1119 and DM2595. The effect of gas at these times (bottom panels) is bimodal. The dark matter aZ of the right block of panels is dominated by the satellite galaxy “Escarabajo”, which applies positive aZ in the positive x – positive y region of the mesh. |
In the bottom row of Fig. 4, we show the acceleration exerted by the gas. We can see that this acceleration is stronger at the disk region, where it is more concentrated. At certain times (e.g., at 4.09 Gyr), the map appears to be divided into two halves, with one half of the gaseous component inducing positive acceleration and the other negative acceleration, suggesting the possibility of a tilted or warped gaseous disk. This observation is further analyzed in Sect. 4.3.
Once the calculation of aZ is carried out, we apply the same Fourier decomposition as in previous sections. This allows us to better visualize the evolution of the vertical accelerations with time, understand the effects that these have on the disk dynamics, and compare them with the results from the previous sections. In the following subsections, we present the accelerations from the different components.
4.1. Accelerations by dark matter
Here we first take the approach of considering the impact of the dark matter as a whole, without excluding any particles belonging to satellites. This will include the effects of the global structure of the halo, its satellites, and associated unbound material, and the possible wakes excited by these satellites. The results are shown in Fig. 5, where we display the amplitude of the m = 1 and m = 2 modes and their respective phases of maximum amplitude, ϕm. At inner radii (< 10 kpc, and mostly in the m = 1 mode), the particles that are likely to dominate the acceleration are the ones from the gravity of the inner structure of the dark matter halo by proximity, with the particles situated at higher radii, such as those from satellites, contributing less. Indeed, in Sect. 5 we show that the inner dark matter structure is triaxial and slightly tilted in relation to the plane of the disk most of the time, producing a constant acceleration. This tilt is especially relevant at certain moments, such as at approximately 1.5 Gyr, which coincides with the moments of higher acceleration at these radii.
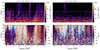 |
Fig. 5. Fourier decomposition of the vertical acceleration by dark matter particles onto the Z = 0 plane. We show m = 1 (left panels) and m = 2, from which we have the amplitude of the mode (top panels) and the phase where the maximum amplitude is located (bottom panels). These are similar to Fig. 3, but extended to 40 kpc in radius. The inner acceleration is dominated by the inner dark matter structure. |
In the outer parts of the disk, the acceleration produced by the dark matter component (> 20 kpc) comes mainly from the dark matter of satellites orbiting the system, especially when they cross the galactic plane. In Sect. 4.2, we study the isolated effects of the satellites in detail.
4.2. Accelerations by satellite dwarf galaxies and dark subhalos
The GARROTXA model is a zoom-in cosmological simulation, and therefore the halo of the main galactic system contains many substructures both in stars and dark matter. Here, we used the Rockstar halo finder (Behroozi et al. 2012) to identify all subhalos that may impact the disk kinematics. With this halo finder, we identify all dark matter structures with M200 > 106 M⊙ (in order to avoid poorly resolved subhalos and contamination by field halo dark matter particles), and we use the dark matter particle IDs to also find all gravitationally bound particles. If the subhalos have stellar mass within 20% of the R200 of the satellite (as calculated by Rockstar), we identify them as luminous. We use the value of M200 right before the infall into the RVir of the host galaxy as a reference of the size and mass of the subhalo. Once the satellites have entered the virial radius of the host, it is highly difficult to determine their mass. In these cases, we use or indicate the bound mass given by Rockstar.
The complete data for the subhalos (including both dark and luminous satellites) found by Rockstar can be found in Fig. C.1. By applying this software, we identified new dark satellites and some dwarf galaxies compared to GC22. In the timespan studied, we found nearly 500 independent subhalos (luminous or dark) that enter the galaxy. As expected from the ΛCDM Universe, we find a large number of dark satellites, that is, subhalos with no stellar particles. For instance, inside the virial radius of the studied galaxy at redshift z = 0, we find 139 of the aforementioned subhalos (those of lower mass get destroyed over time) without any stellar particle, compared to 10 dwarf galaxies. These dark satellites, although generally less massive than dwarf galaxies, can interact with the disk as luminous satellites would.
Figure 6 shows the top left panel of Fig. 5 again, that is, the amplitude of the m = 1 mode of the dark matter vertical acceleration, but now also showing the total (and not just the vertical) acceleration from each subhalo acting on the center of the galactic disk. The total acceleration by the most important dark satellites is shown with dashed lines, whereas that contributed by the satellites containing stellar particles are shown with solid lines. The radius and time at which each satellite crosses the plane are marked by a cross of the same color. We observe that the increase in vertical acceleration in the regions from 25 to 40 kpc (background colors) is consistent with the close encounter with subhalos, both dark and luminous (lines and crosses). The constant disk crossing of the many dark and luminous satellites is permanently perturbing the disk. However, only those of higher mass and those that get closer to the galactic plane show significant aZ (see background colors vs. lines). For instance, at 5.1 Gyr or 2.9 Gyr, the dark satellites DM2512 and DM1747 (violet and yellow lines) cross the disk but we do not observe a strong increase in aZ (background colors).
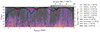 |
Fig. 6. Total gravitational acceleration magnitude produced by each individual subhalo acting on the center of the galactic system (colored lines, right y-axis) and the sum of acceleration contributed by the remaining (less massive) subhalos (black dashed line, right y-axis). Subhalos containing stellar particles are indicated as solid lines, and those with pure dark matter are shown as dashed lines. We also marked the moments and positions (cylindrical radius, left axis) when the satellites (“x”) cross the galactic plane; those in gray correspond to the crossings of less massive satellites. Background color and left axis are equivalent to the top-left panel in Fig. 5. We note that, while the background color shows the vertical acceleration by all dark matter on the galactic plane Z = 0, lines show the total acceleration produced by subhalos at the galactic center, not at the Z = 0 plane. These latter contribute proportionally lower values of acceleration because of the difference in distance between the satellite and the closest point of the plane and the satellite and the center of the galaxy. For the lines, we also use the data regarding Mbound for each satellite, which id reevaluated at each apocenter. The masses indicated on the label are the first mass registered for each satellite, which corresponds to M200. In this figure, we see that the vertical acceleration from the dark matter halo between 25 and 40 kpc is correlated with the pericentric passages of several satellites, dark or luminous. The ones exerting more vertical acceleration are DM1119 and Escarabajo, as well as DM479 and DM2113 at later times. |
In contrast, the strongest interactions that we observe are the following. First, a strong interaction occurs at 4.1 Gyr, and is due to a dark satellite (DM1119, blue dashed curve) containing a mass of 1.1 × 10⁹ M⊙. This interaction is fast, and the pericenter occurs when the object is crossing the plane, at 20 kpc. This satellite is accompanied by another dark satellite, DM2595, with a mass of 108 M⊙ (orange), and the second pericenter of the dwarf galaxy Arania, whose mass at this moment is of 1.3 × 10⁹ M⊙ (blue line with stars).
Secondly, another noticeable moment is the interaction occurring at 2.2 Gyr with a dwarf galaxy that we refer to as “Escarabajo” (light green). This satellite starts its interaction with 1.6 × 10⁹ M⊙, and the interaction is slower than the previous example at 4.1 Gyr. In this case, the pericenter does not occur near the galactic plane, yet we see a band of strong acceleration in the background colors. The black dashed line is the sum of the accelerations of those satellites whose mass does not exceed 108 M⊙ or whose maximum acceleration does not exceed 2 km s−1 Myr s−1. This shows the accelerations of different dark matter subhaloes that, although less massive, may have a relation to some of the increases seen in the aZ applied by the dark matter particles. However, the increase in acceleration by dark matter is not always related to passing satellites. We find that at 1.1 Gyr, the increase is not entirely explained by the passing of minor satellites, as in the case of Fig. 4. By examining the acceleration by dark matter in the X − Y projection, we find that this is related to the overall dark matter distribution. As discussed in Sect. 5.2, at these times there are instabilities of the galaxy that coincide with net accelerations on the plane. Finally, from around 1 Gyr until the present, we observe several subhalos, which overall increase the accelerations in the intermediate and outer regions, such as the pink and light green ones with pericenters occurring at 0.4 and 0.26 Gyr, respectively.
4.3. Acceleration by gas
We apply the same method as in Sect. 4.1 to the gas cells of the simulation, and the results are shown in Fig. 7. In the bottom left panel, which shows the phase of the mode m = 1, we see a sharp transition between the outer parts and the inner parts of the disk. This transition is located between 5 and 10 kpc during the first snapshots and between 10 and 15 kpc from 5 Gyr onward. This transition can also be seen as a sort of break in the amplitude.
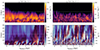 |
Fig. 7. Fourier decomposition of the acceleration of the gas cells (similar to Fig. 5) onto the Z = 0 plane (galactic plane). We show m = 1 (left panels) and m = 2, from which we have the amplitude of the mode (top panels) and their corresponding phase of the maximum amplitude (bottom panels). |
At the inner regions, between 4.5 and 3.5 Gyr, we observe a retrograde rotating mode m = 1 that extends to approximately 10 kpc. This pattern has a period of between 300 and 500 Myr and is similar to that of the inner bending wave seen in the left panels of Fig. 3. Indeed, we see that at these times and radius, the gaseous disk can be misaligned with the stars by about 4° (top panel of Fig. A.1), which is what causes this specific mode m = 1 in acceleration.
At the outer parts (at radius of R > 15 kpc), we observe low amplitudes of the mode m = 1 of acceleration (top left panel). At these radii, there is a rather constant phase (bottom left panel), which corresponds to an approximate angle of −90° (blue colors). In this same panel, from 2 Gyr onward, this phase changes to red/black (corresponding to angles of between 50° and 100°), propagating toward the outer radius. This is accompanied by a higher amplitude (top left panel). From 1 to 0 Gyr the amplitude of m = 1 decreases, and the phase shows similar angles to previous instances. We examined the gas distribution and its temperature in our model in order to study this in more detail.
Figure 8 shows the gas in a zoomed-out, face-on projection (left column), a zoomed-out, edge-on projection (central column), and a zoomed-in, edge-on projection of the gaseous disk (right column) color coded according to temperature. In the first row (5.61 Gyr), we see a highly clumpy distribution of cold (blue) gas stripped from Arania at its first encounter (at > 6 Gyr). The right panel of this row (zoom-in) shows a deformed gaseous disk that is highly tilted from the galactic plane.
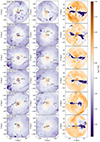 |
Fig. 8. Distribution and temperature of the gas in GARROTXA. Left and central columns: zoomed-out face-on (Y–X plane) and edge-on (Y–Z plane) projection of the gas temperature at six different instances of the simulation, color coded according to temperature. The crosses and dashed lines indicate the position and direction of the satellites Arania and Escarabajo. Right column: edge-on projection of the gaseous disk, color coded according to temperature. The dotted horizontal line represents the plane of the stellar disk. The main inflow is reaching the galaxy from the negative Y direction. |
Over time, as seen in the next rows of zoomed-out, face-on panels, the gas falls into the galaxy preferably through a cold (blue) gas filament in the negative Y and positive X direction of −50° approximately at radii of > 50 kpc, and −90° approximately at smaller radii throughout almost all snapshots studied. This is especially clearly seen in the panels of 2.88, 2.56, and 1.88 Gyr (first column of the third, fourth, and fifth row, respectively, where the gas falls from the left parts of the plane, dominated by blue colors). Indeed, the latter direction of −90° is compatible with the observed phase of the acceleration in the Fourier mode m = 1. This gas is a mixture of that stripped from satellites (Arania’s at early times, mostly tidally in its first pericenter, and ram-pressure stripped from Escarabajo at later times) and that outflowing from the disk at an early time through supernova winds and initially kept in the circumgalactic medium. This metal-rich gas has shorter cooling times and thus falls into the galaxy (Dekel & Birnboim 2006).
In particular, at 2.88 Gyr, Escarabajo is already inside the virial radius and, as mentioned above, has suffered ram-pressure stripping due to the presence of a warm-hot gas corona around the galaxy. Gas stripped from Escarabajo mixes with the preexisting inflowing gas (as seen at 2.88 Gyr and 2.56 Gyr in the third and fourth rows, respectively), cools down, and, over the next half gigayear, enters the disk and increases the star formation (see Fig. 5 in GC22). Following this star formation event, from 2 Gyr onward, we observe a change in the phase of the m = 1 mode (in Fig. 7) along with a higher amplitude of m = 1 in aZ, which propagates from the inner parts toward the outer radii. At these times, the gaseous disk is tilted with respect to the stellar disk due to the recent interaction with the satellite Escarabajo. After examining the snapshots, we observe that there is also an anisotropic ejection of gas from the supernova winds following the aforementioned star formation event in this direction, which might be further perturbing the disk in this direction. As a consequence of these different phenomena, at 1.88 Gyr (right panel of fifth row in Fig. 8) the gaseous disk is tilted by about 4° to 8° (as seen in Appendix A, and in Sect. 5). Along the last gigayear of evolution, star formation is regulated by the galactic fountain leading to new supernova events (although with weaker mass ejection than in the former case).
5. Triggering agents of bending deformation
In this section, we present the connection that we find between the times of higher vertical acceleration (from both dark matter and gas) and the behavior of the disk in terms of the bending modes calculated in previous sections. In Fig. 9 we take the data from Figs. 3, 5, and 7, and obtain the mean amplitude of the Fourier modes within radial bins (see top labels) in order to compare them at specific radial regions. Panel A shows the mean amplitude of the m = 1 Fourier mode of the vertical acceleration produced by dark matter between 20 and 40 kpc. In this region, the effects of satellites and dark matter subhalos are dominating, as seen in Sect. 4.1, and we see clear peaks at their moments of maximum approach. Panels B and F show the mode m = 1 of the acceleration by gas (orange line) and dark matter (blue line) at radii from 10 to 20 kpc and 0 to 10 kpc, respectively. We observe that the amplitude of the m = 1 mode of aZ applied by the gas is as significant as that by the dark matter and is even more dominant in the region from 10 to 20 kpc because of its strong misalignment with the disk. At radii from 0 to 10 kpc, the m = 1 acceleration by the gas is comparable to that exerted by the dark matter halo. However, in terms of total vertical acceleration, the inner dark matter triaxial structure dominates because of the contribution of higher modes (Fig. 5).
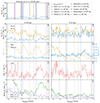 |
Fig. 9. Mean acceleration by the components of the simulations (dark matter and gas), tilting, and mean of the bending modes. Top left panel A: mean value of the amplitude of the Fourier mode m = 1 of aZ applied by the dark matter particles on the plane (blue lines) at external radii (20–40 kpc). The vertical lines show the moments of maximum approach to the disk by those satellites of higher mass, and the labels indicate their M200 at infall. The left panels show the calculated properties at radii from 10 to 20 kpc, whereas the right panels show these properties between 0 to 10 kpc. Panels B and F show the mean value of the amplitude of mode m = 1 of the vertical acceleration of dark matter (blue lines) and gas (orange lines). Panels C and G show the difference in angle between the angular momentum of stars and the angular momentum of gas (dotted orange lines, leftmost axis), and also the tilt of the central dark matter triaxial structure with respect to the disk (dotted blue lines rightmost axis), denoted by θgas and θellipsoid, respectively. Panels D and H show the angular momentum vector variation in relation to the previous snapshot divided by the time span. Panels E and I show the mean amplitude of Fourier amplitudes for bending modes m = 1 (green lines) and m = 2 (purple lines). |
In addition to this, we calculate the angle between the angular momentum vector of the stellar disk and that of the gas measured in spherical shells with radii of between 10 and 20 kpc and between 0 and 10 kpc (dashed orange line in panels C and G, respectively). We observe that there is a correlation between the acceleration applied by gas and its angular misalignment with the disk. As mentioned in Sect. 4.1, here we also obtained the tilt of the central dark triaxial structure with respect to the stellar disk by calculating its maximum height and corresponding radius, with the former being the Fourier amplitude of the vertical distribution of dark matter particles in a cylinder with |Z|< 10 kpc. Although this tilt is only of 0.5–1.25° at times (blue lines in panels C and G), given the total mass of the triaxial inner dark matter structure this is enough to create large accelerations like the ones observed in Fig. 5. We also measure the changes in the angular momentum direction of the stellar disk in relation to the previous snapshot, taking the cosmological box as a reference (panels D and H). Panels E and I show the mean amplitudes of the bending modes m = 1 (green lines) and m = 2 (purple lines) for regions between 10 and 20 kpc and between 0 and 10 kpc, respectively.
The perturbed initial state of the galaxy and the successive interactions with satellites make it very difficult to pinpoint a moment at which the galaxy is at equilibrium along its history. However, in Sect. 4, we describe the key moments where interactions with satellites and dark matter subhalos occur. Based on these, we divide our analysis into two intervals. The first is defined by the interaction with the dark satellites (at 4.1 Gyr), and the other is that of the dwarf satellite galaxy Escarabajo (at 2.2 Gyr). We study both interactions in more detail and their possible consequences on the disk. In Appendix D, we briefly study how these variables correlate with each other more quantitatively. A more descriptive explanation based on the findings of Appendix D and Fig. 9 is presented below.
5.1. Multiple dark and luminous satellites and bending waves
In Fig. 3, at 4.1 Gyr, we can see that a higher amplitude of bending mode m = 1 is excited in the inner (< 5 kpc) parts of the disk. In the external parts (> 10 kpc), the increase starts later (from approximately 3.9 Gyr onward). Both increases are in relation to previous instances where the amplitude is lower. In the case of outer radii, we observe a very slow bending mode m = 1 and prograde bending mode m = 2, which coincide with the pericenters of two of the dark satellites (DM1119 and DM2595) at 4.1 Gyr. These have virial masses M200 of 109 and 108 M⊙, plane-crossing positions at cylindrical galactocentric radii of 20 kpc and 15 kpc, and velocities VZ of 364 km s−1 and 386 km s−1, respectively. Their gravitational acceleration can be seen in the first three top panels of Fig. 4, and in Fig. 6. The pericenters of these satellites are compatible with the increase in bending modes at outer radii. During this time, the second pericentric passage of the satellite Arania also takes place at 3.9 Gyr (blue line in Fig. 6), which at the time of this interaction has a bound mass Mbound of 1.1 × 10⁹ M⊙, as calculated by Rockstar (5 × 10⁸ M⊙ as calculated in GC22 by measuring the tidal radius at apocenters of the orbit), which may also reinforce the bending patterns.
The inner retrograde bending pattern does not have a clear origin; it seems to be present throughout the studied time span. The oscillation of the inner bending mode (panel I of Fig. 9) could be related to the inner density structures of the disk (see Appendix B), but, specifically from 4 Gyr, it has a higher amplitude with a maximum at 3.5 Gyr (top left panel of Fig. 3) and a more clear phase (bottom left panel of Fig. 3). In Sect. 4.3, we find that the accelerations from the gas show a wave-like pattern with similar behavior in rotation and periodicity. The amplitude of this wave-like pattern (panel F) increases approximately 400 Myr before the interaction with the dark satellites DM1119 and DM2595 (blue and orange line respectively, at 4.1 Gyr), and other less massive subhalos near the disk at that moment. It is therefore unlikely that these subhalos are the cause of the increase in inner bending. At these times, we also see a slight misalignment in the gas (panel G). Our hypothesis is that gas is being accreted and is destabilizing both the stellar and gaseous disk, inducing these specific bending waves, or at least enhancing the already existing one.
5.2. Distant interaction triggering bending modes via disk misalignment
The dwarf satellite Escarabajo has a total M200 of 1.6 × 10⁹ M⊙, and a stellar mass of 6 × 10⁶ M⊙ at its first infall, before its closest approach (2.2 Gyr). This interaction is slower (VZ = −50 km s−1 at the moment of the pericenter) than those mentioned in the previous subsection (see Sect. 5.1). The pericentric passage of Escarabajo occurs at R = 40 kpc and at 16 kpc above the plane, thus far from it. We see in Fig. 6 that the vertical acceleration by this satellite is mostly at the outer disk and barely reaches the inner parts. Even though the amplitude of the bending mode m = 1 (panel E of Fig. 9) reaches its maximum a gigayear later, its increase starts approximately 300 Myr after the pericenter of Escarabajo, which is half of the rotation period at these outer parts (600 Myr at 20 kpc). Furthermore, we need to take into account that, this being a slower interaction, the acceleration is not only applied at the moment of the pericenter but also several million years before and after its maximum approach. This initial increase is therefore compatible with the passing of Escarabajo.
The angular momentum of the stars also starts to change at 300 Myr after Escarabajo’s passing (as seen in panels D and H). This indicates that Escarabajo’s passage pulls and tilts the disk, especially at outer radii, where self-gravity is smaller. The disk also slightly shifts from its alignment with the central triaxial structure of the dark matter halo, which also generates accelerations that prevail over a longer time span. This creates a misalignment between the disk and the triaxial structure of central dark matter and old stars (panel G), which also exerts an acceleration on the former. This is reflected in the amplitude of mode m = 1 of the acceleration contributed by dark matter (panels B and F, blue lines), which reaches its maximum at approximately 1.2 Gyr.
Furthermore, in Sect. 4.3, we show how Escarabajo loses its gas, and that this mixes with previous existing inflows. We measure the cold gas inside Escarabajo’s virial radius before its maximum approach and we find that this satellite contributes 107 M⊙ of cold gas; that is, this is the amount of gas contributed by this satellite (T < 104 K). At these times, the misalignment of the gas disk in relation to the plane is 8° (panel C of Fig. 9) and there is an associated increase in the vertical acceleration applied by the gas at radii of 10–20 kpc (panel B). This is a period of destabilization of both the gaseous and stellar disk as a consequence of the direct interaction with Escarabajo. Even though the infalling gas may not induce large perturbations by itself, that is, because of its mass, this new gas is settling at a different angle from the plane of the disk. This new gas forms stars and the subsequent supernovae bubbles further perturb the disk.
The bending mode m = 1 finally reaches its maximum at approximately 1.1 Gyr. This perturbation is present across stellar populations as a whole, but we find that it is stronger in stellar particles of approximately 4 to 6 Gyr of age. The phase of this bending mode (bottom left panel of Fig. 3) indicates that it is aligned with the major axis of the central triaxial dark matter structure, which at this moment is tilted in the opposite direction. Thus, the central triaxial structure of the dark matter halo appears to be important for the behavior of the bending pattern once it has been triggered. In Sect. 6, we also briefly discuss the possible effects of the disk itself on the shape of the bending wave.
The high level of complexity of the system implies the existence of interactions that are amplified (or dampened) by the different components and structures. Therefore, the gas and especially the central triaxial dark matter structure seem to contribute to a general destabilization between different parts of the disk, leading to the amplification and prolongation in time of the bending mode. There is expected to be a delay in the large-scale effects caused by the “tug” of satellites if they induce other imbalances. In addition to this, there are also all the new passages of other, less massive but non-negligible satellites from 1 Gyr onward (see Fig. 6).
6. Discussion and conclusions
6.1. Summary
The existence of vertical waves and vertical phase mixing in the MW and in other galaxies motivated our exploration of the bending modes in the stellar disk of the GARROTXA cosmological simulation. Using Fourier decomposition, we analyzed these modes and the vertical gravitational accelerations produced by the dark matter halo, gas, and satellite galaxies. The main findings from our study of the bending of the stellar disk can be summarized as follows:
-
The bending behavior of the stellar disk is much more complex than previously seen in N-body simulations with different regimes at different radii and times. Throughout the simulation, we find different m = 1 modes that are coexistent but excited at different times: One is slower and extends from ∼7 kpc to 20 kpc. This external mode is generally aligned with the major axis of the inner structure of old stars and dark matter. We also find an inner, with much-lower-amplitude retrograde mode with high frequency dominating at < 5 kpc.
-
The amplitudes of the bending mode are high in the early stages of the formation of the thin disk (20 km s−1) and can be up to 8.5 km s−1 in the late disk evolution.
-
The slow pericentric passage of a satellite galaxy of M200 = 1.6 × 10⁹ M⊙ triggers a tilt in the disk. When the stellar disk is tilted, it becomes misaligned with the inner dark matter triaxial structure (formed in an ancient major merger), which is less responsive to these perturbations as it is more massive. The effect on the disk bending is magnified by this new misalignment with the inner dark matter structure, leading to the highest vertical deformation in the last several gigayears of evolution.
-
When the satellite enters the virial radius of the host, the gas of the satellite is also stripped by ram pressure and slowly cools down and falls into the disk along with pre-existing inflows. This cold gas enters the stellar disk nonisotropically, settles in a slightly tilted new gaseous disk, and then, later, induces new star formation events and the creation of supernova bubbles. Even though these processes may have a weaker impact on the disk, they are compatible with the accelerations seen to be exerted by the gaseous disk. It is therefore possible that all these processes magnify the initial bend.
-
After one of the several interactions with dark subhalos, the inner m = 1 retrograde bending mode increases its amplitude and shows a phase pattern that correlates with that of the vertical acceleration of the gas. Although this amplitude is lower than the external bending discussed above, this may suggest that the gas–stellar disk misalignment plays an important role in the observed bending of the inner disk.
6.2. Discussion
We identified the following agents that trigger the bending of the stellar disk:
-
Dark subhalos: Dark satellites with masses of ∼109 M⊙ interact with the stellar disk on many occasions coinciding with a higher amplitude of the bending mode m = 1. The presence of such dark subhalos is expected in the ΛCDM galaxy formation theories and their interaction with the disk has been mostly studied as a source of disk heating (see e.g., Benson et al. 2004; D’Onghia et al. 2016). Here, we highlight the role of such structures as triggers of bending perturbations of the disk.
-
Satellite galaxies: Satellite galaxies in the GARROTXA simulation at z > 2 have at most M200 ∼ 1010 M⊙ before their first infall, and most of them do not reach inner regions of the galaxy. However, although their direct tidal influence in the inner stellar disk is not large, they lead to a cascade of events that trigger some perturbations, as discussed below.
-
Inner density profile: The inner triaxial structure of the dark matter is an imprint of its ancient accretion history. At certain times, the largest vertical gravitational acceleration comes from a misalignment between the stellar disk and this dark matter ellipsoid. The misalignment is triggered by the tilting of the stellar disk, and the resulting bending can last for more than 1 Gyr. Similar phenomena were observed by Sellwood & Debattista (2022), where slow, bending waves arise from misalignment between the inner and outer regions of the disk. We cannot discard the possibility that an intrinsic coupling mode between the disk and halo contributes to this deformation. Furthermore, it is possible that the overall inner density profile of the disk also exerts a torque after the initial disk tilting, resulting in the leading shape of the warp (Shen & Sellwood 2006; Gómez et al. 2016), which is worth exploring in a future analysis.
-
Gas accretion and misaligned gaseous structures: The vertical accelerations from the gaseous structures, often misaligned with the stellar disk, are comparable with those from satellites and dark matter. The origin of this misalignment is the inhomogeneity of the cold flows, the slightly different angular momentum of the incoming gas with respect to the actual stellar disk, and the expansion of supernova bubbles. We speculate that all these phenomena may have a further impact on the bending behavior of the stellar disk, although we cannot measure the exact relative impact of each phenomenon with respect to the others. The effect of extra-planar inhomogeneously distributed gas has also been detected as a source of vertical patterning and disk tilting in other models (e.g., Gómez et al. 2017; Khachaturyants et al. 2022).
Below, we discuss other perturbation mechanisms that we have not looked into in detail but that may require special consideration:
-
Wake: We have not found a dominant global asymmetry like the one expected when a strong wake is present in the Fourier analysis of the GARROTXA model. This could be because there is only one satellite galaxy with comparable mass to the Sagittarius dwarf galaxy, and its pericenter occurs at large radii from the center of the main host. This satellite has a mass of greater than 1010 M⊙ before entering the virial radius of the host for the first time, and loses mass down to 4.7 × 10⁹ M⊙ at the moment of the first pericenter. As the orbit of the satellite is mostly polar and slightly retrograde, we expect most of the torque to be in the vertical direction. However, in our case, both the collective and transient response to the wake would be weaker than expected for a Sagittarius-like satellite. Although we have not quantified the exact torque applied by the wake, its effects are already captured by our calculation of the acceleration contributed by all dark matter particles. Furthermore, because of the dipolar nature of the halo’s response, the wake effects are accounted for in our Fourier analysis.
-
Streams: We also studied the tidal streams from Arania after its first pericenter (both stellar and dark matter debris), finding that the maximum vertical acceleration applied by this material is negligible in comparison with the progenitor and the rest of the dark matter halo. However, in the case of more massive satellites, their debris could be significant enough to affect the general structure of the dark matter halo (Garavito-Camargo et al. 2021).
-
Density structures of the disk: Other structures present in the GARROTXA model are a central stellar oval and a one-armed retrograde density pattern (see Appendix B). We find some weak correlations between the nonaxisymmetric structures of this stellar disk and the breathing mode. Therefore, we suspect that the physics of the vertical behavior in our model is also related to the density structure of the disk. However, we will study how these self-gravitating structures can perturb the disk in the future (see e.g., Grion Filho et al. 2021 for an analysis in a pure N-body simulation).
In GC22, we detected an increase in the amplitude of the phase spirals in intermediate-age stars that coincided with the percienters of the most important satellites. We observe that the periodicity of the thick bands present in Fig. 5 of GC22 is of approximately 1.2 Gyr, which is roughly coincident with the period of the one-armed density mode (Appendix B). This suggests that the phase spiral may propagate as this density mode in our model. The observed phase spirals are related to the phase mixing of the bending modes of the disk studied here, even if these do not appear to be very large compared to other models (amplitudes of 8.5 km s−1 in this model compared to amplitudes up to 30 km s−1 in Gómez et al. 2017). Tremaine et al. (2023) propose a mixed scenario with several large-scale perturbations and numerous small-scale perturbations. This is qualitatively compatible with our model in the sense that multiple dark (and not dark) satellites are affecting the disk. However, due to the resolution limitations, and the several interactions occurring simultaneously, we are not able to accurately track the spiral pattern or measure the winding of the phase spiral, and, except for some temporal coincidences, we cannot attribute them to a specific event. The conclusions of this work also point to a mixture of many processes (not present in the model of Tremaine et al. 2023) such as the structure of the dark matter halo, the accretion history, the gas content, and so on.
We conclude that although further study is needed, the phase spirals we observe could be a consequence of the many perturbations that the stellar disk suffers directly or indirectly in relation to the infall of satellite galaxies, but could also be a product of gas accelerations and the structure of the inner dark matter.
6.3. Caveats
There are also some caveats in our study that need to be considered. For our analysis, we define a new reference system at each time step. However, it is not trivial to define a midplane with such a complex vertical structure, with different bending at different radii or for different populations. Variations in the determination of the galactic plane can lead to inaccuracies in the measurements of dynamical properties (Beane et al. 2019).
Application of the tools used in this work is necessary to detect and analyze the variety of processes taking place in cosmological simulations. These tools can also be used to analyze a larger set of models, which is crucial for a more global understanding of disk dynamics in real galaxies. However, another caveat in our methodology is that our Fourier analysis does not always provide conclusive evidence to establish true causality. This likely comes from two aspects. Firstly, when there are many processes in place, and some of them are complexly interconnected, it is not straightforward to distinguish between real agents of perturbation and simply coexisting effects, or even to separate causes from their effects. Secondly, this limitation might also be related to the Fourier analysis. Localized accelerations, such as those from subhalos and satellite galaxies, will be somehow smoothed by the sine/cosine decomposition, especially when we only keep the series to the first orders (m = 1 and m = 2 modes). In the case of the internal nonaxisymmetric dark matter structure, its total acceleration is not completely captured by the m = 1 mode, because it is also dominant in higher modes. Finally, as there are different disk regimes with radial limits that change with time, our analysis can be biased by exploring the disk in rings of fixed radius that might not be the natural ones.
To overcome these limitations, in the future, it might be worth exploring basis function expansions or multichannel singular-spectrum analysis for both the acceleration field and the disk kinematic perturbations. More sophisticated tools to link the different agents and effects might improve our correlation analysis (Appendix D). These techniques are starting to be applied to disk dynamics in more controlled simulations (Weinberg & Petersen 2021; Garavito-Camargo et al. 2021; Johnson et al. 2023) and this might establish the foundations for its application in more complex cases, such as the model used here. These expansions might also be useful for a more global study of the dynamics, that is, not centered exclusively on the vertical or planar dimensions.
Also, even if the number of satellites in this model is compatible with the predictions for the mass of the MW (Bullock & Boylan-Kolchin 2017), a lack of interaction with massive satellites (M* > 1010 M⊙) in this system that could be equivalent to the Large Magellanic Cloud and Small Magellanic Cloud means that direct comparison with the MW is challenging at the present time. However, this exercise helps us to understand the evolution of disk galaxies in a global way, where past interactions can have a long-lasting impact on stellar disk morphology and kinematics.
6.4. Final conclusions and remarks
A general conclusion of our work is that even galaxies that are far from dense groups can be highly and complexly perturbed systems in a realistic cosmological context, never reaching dynamical equilibrium. We adopt the idea of Grion Filho et al. (2021) of the importance of a holistic approach to disk dynamics, to which we add here additional factors, namely the effects of the inner profiles of dark matter and old stars from previous major mergers, and of the gas brought in by satellites and accreted through filaments. These factors are often overlooked by more simplistic models that therefore do not capture the full complexity of galactic systems.
It is undoubtedly a huge effort to bring cosmological simulations into the picture of disk dynamics. Although detecting and understanding the complex interplay between all existing phenomena and the different dynamical regimes in the disk in cosmological simulations is challenging, the analysis of coexisting perturbative processes will lead to more realistic galactoseismology.
As calculated in GC22, computed following Bryan & Norman (1998), where they use the spherical collapse model to determine the virial overdensity Δv(z) as a function of the redshift, and taking this value to be 333, i.e., R333 = Rv, hereafter.
Similarly, we can analyze the breathing modes by using Wi = Ai and the density modes by using Wi = Mi. This is indeed what we do in Appendix B.
Acknowledgments
We thank the referee Dr. Robert Grand for his insightful comments which have improved this paper. We thank Marcel Bernet, Merce Romero-Gomez, Oscar Jimenez, and Francesca Fragkoudi for discussions about the reference system. We also thank Esperanza Mur for her initial studies of the Fourier density modes of this model. B.G.C. and S.R.F. work has been supported by the Madrid Government (Comunidad de Madrid-Spain) under the Multiannual Agreement with Complutense University in the line Program to Stimulate Research for Young Doctors in the context of the V PRICIT. They also acknowledge financial support from the Spanish Ministry of Economy and Competitiveness (MINECO) under grant number AYA2016-75808-R, AYA2017-90589-REDT, RTI2018-096188-B-I00 and S2018/NMT-429, and from the CAM-UCM under grant number PR65/19-22462. B.G.C. acknowledges IPARCOS Institute for the grant “Ayudas de doctorado IPARCOS-UCM/2022”. T.A. acknowledges the grant RYC2018-025968-I funded by MCIN/AEI/10.13039/501100011033 and by “ESF Investing in your future”. This work was (partially) supported by the Spanish MICIN/AEI/10.13039/501100011033 and by “ERDF A way of making Europe” by the “European Union” and the European Union ≪ Next Generation EU≫/PRTR, through grants PID2021-125451NA-I00 and CNS2022-135232, and the Institute of Cosmos Sciences University of Barcelona (ICCUB, Unidad de Excelencia ‘María de Maeztu’) through grant CEX2019-000918-M. S.R.F. also acknowledges support from a Spanish postdoctoral fellowship, under grant number 2017-T2/TIC-5592. S.R.F. acknowledges support from the Knut and Alice Wallenberg Foundation and the Swedish Research Council (grant 2019-04659). P.R. acknowledges support by the Agence Nationale de la Recherche (ANR project SEGAL ANR-19-CE31-0017 and project ANR-18-CE31-0006) as well as from the European Research Council (ERC grant agreement No. 834148). Simulations were performed on the MIZTLI supercomputer at the LANACAD, UNAM, within the research project LANCAD-UNAM-DGTIC-151. F.A.G. acknowledges support from ANID FONDECYT Regular 1211370, the Max Planck Society through a “Partner Group” grant and ANID Basal Project FB210003. M.A.G.F. and B.G.C. acknowledge financial support from the Spanish Ministry of Science and Innovation through the project PID2020-114581GB-C22. Software: yt (Turk et al. 2011), NUMPY(Van Der Walt et al. 2011), SCIPY (Jones et al. 2001), SCIKIT-LEARN (Pedregosa et al. 2011; Buitinck et al. 2013). This research has made use of NASAs Astrophysics Data System (ADS), and the curated research-sharing platform arXiv.
References
- Alinder, S., McMillan, P. J., & Bensby, T. 2023, A&A, 678, A46 [NASA ADS] [CrossRef] [EDP Sciences] [Google Scholar]
- Antoja, T., Helmi, A., Romero-Gómez, M., et al. 2018, Nature, 561, 360 [Google Scholar]
- Antoja, T., Ramos, P., García-Conde, B., et al. 2023, A&A, 673, A115 [NASA ADS] [CrossRef] [EDP Sciences] [Google Scholar]
- Beane, A., Sanderson, R. E., Ness, M. K., et al. 2019, ApJ, 883, 103 [Google Scholar]
- Behroozi, P. S., Wechsler, R. H., & Wu, H.-Y. 2012, ApJ, 762, 109 [Google Scholar]
- Bennett, M., & Bovy, J. 2021, MNRAS, 503, 376 [NASA ADS] [CrossRef] [Google Scholar]
- Benson, A., Lacey, C., Frenk, C., Baugh, C., & Cole, S. 2004, MNRAS, 351, 1215 [CrossRef] [Google Scholar]
- Binney, J., & Schönrich, R. 2018, MNRAS, 481, 1501 [Google Scholar]
- Bland-Hawthorn, J., Sharma, S., Tepper-Garcia, T., et al. 2019, MNRAS, 486, 1167 [NASA ADS] [CrossRef] [Google Scholar]
- Bland-Hawthorn, J., & Tepper-García, T. 2021, MNRAS, 504, 3168 [CrossRef] [Google Scholar]
- Brown, A. G., Vallenari, A., Prusti, T., et al. 2021, A&A, 649, A1 [NASA ADS] [CrossRef] [EDP Sciences] [Google Scholar]
- Bryan, G. L., & Norman, M. L. 1998, ApJ, 495, 80 [NASA ADS] [CrossRef] [Google Scholar]
- Buitinck, L., Louppe, G., Blondel, M., et al. 2013, arXiv e-prints [arXiv:1309.0238] [Google Scholar]
- Bullock, J. S., & Boylan-Kolchin, M. 2017, ARA&A, 55, 343 [Google Scholar]
- Carrillo, I., Minchev, I., Kordopatis, G., et al. 2018, MNRAS, 475, 2679 [NASA ADS] [CrossRef] [Google Scholar]
- Chakrabarti, S., & Blitz, L. 2009, MNRAS, 399, L118 [NASA ADS] [CrossRef] [Google Scholar]
- Chakrabarti, S., & Blitz, L. 2011, ApJ, 731, 40 [NASA ADS] [CrossRef] [Google Scholar]
- Chequers, M. H., Widrow, L. M., & Darling, K. 2018, MNRAS, 480, 4244 [CrossRef] [Google Scholar]
- Darling, K., & Widrow, L. M. 2019, MNRAS, 484, 1050 [CrossRef] [Google Scholar]
- Debattista, V. P. 2014, MNRAS, 443, L1 [NASA ADS] [CrossRef] [Google Scholar]
- Dekel, A., & Birnboim, Y. 2006, MNRAS, 368, 2 [NASA ADS] [CrossRef] [Google Scholar]
- de la Vega, A., Quillen, A. C., Carlin, J. L., Chakrabarti, S., & D’Onghia, E. 2015, MNRAS, 454, 933 [NASA ADS] [CrossRef] [Google Scholar]
- D’Onghia, E., Madau, P., Vera-Ciro, C., Quillen, A., & Hernquist, L. 2016, ApJ, 823, 4 [Google Scholar]
- Faure, C., Siebert, A., & Famaey, B. 2014, MNRAS, 440, 2564 [CrossRef] [Google Scholar]
- Feldmann, R., & Spolyar, D. 2015, MNRAS, 446, 1000 [NASA ADS] [CrossRef] [Google Scholar]
- Frankel, N., Bovy, J., Tremaine, S., & Hogg, D. W. 2023, MNRAS, 521, 5917 [NASA ADS] [CrossRef] [Google Scholar]
- Gaia Collaboration (Brown, A. G. A., et al.) 2018, A&A, 616, A1 [NASA ADS] [CrossRef] [EDP Sciences] [Google Scholar]
- Gandhi, S. S., Johnston, K. V., Hunt, J. A., et al. 2022, ApJ, 928, 80 [NASA ADS] [CrossRef] [Google Scholar]
- Garavito-Camargo, N., Besla, G., Laporte, C. F., et al. 2021, ApJ, 919, 109 [NASA ADS] [CrossRef] [Google Scholar]
- García-Conde, B., Roca-Fàbrega, S., Antoja, T., Ramos, P., & Valenzuela, O. 2022, MNRAS, 510, 154 [Google Scholar]
- Gómez, F. A., Minchev, I., O’Shea, B. W., et al. 2013, MNRAS, 429, 159 [Google Scholar]
- Gómez, F. A., White, S. D., Marinacci, F., et al. 2016, MNRAS, 456, 2779 [CrossRef] [Google Scholar]
- Gómez, F. A., White, S. D. M., Grand, R. J. J., et al. 2017, MNRAS, 465, 3446 [Google Scholar]
- Gómez, F. A., Torres-Flores, S., Mora-Urrejola, C., et al. 2021, ApJ, 908, 27 [CrossRef] [Google Scholar]
- Grand, R. J. J., Pakmor, R., Fragkoudi, F., et al. 2023, MNRAS, 524, 801 [NASA ADS] [CrossRef] [Google Scholar]
- Grion Filho, D., Johnston, K. V., Poggio, E., et al. 2021, MNRAS, 507, 2825 [NASA ADS] [CrossRef] [Google Scholar]
- Hunt, J. A. S., Stelea, I. A., Johnston, K. V., et al. 2021, MNRAS, 508, 1459 [NASA ADS] [CrossRef] [Google Scholar]
- Hunt, J. A., Price-Whelan, A. M., Johnston, K. V., & Darragh-Ford, E. 2022, MNRAS, 516, L7 [NASA ADS] [CrossRef] [Google Scholar]
- Johnson, A., Petersen, M. S., Johnston, K. V., & Weinberg, M. D. 2023, MNRAS, 521, 1757 [CrossRef] [Google Scholar]
- Jones, E., Oliphant, T., Peterson, P., et al. 2001, SciPy: Open source scientific tools for Python [Google Scholar]
- Khachaturyants, T., Beraldo e Silva, L., Debattista, V. P., & Daniel, K. J. 2022, MNRAS, 512, 3500 [NASA ADS] [CrossRef] [Google Scholar]
- Kumar, A., Ghosh, S., Kataria, S. K., Das, M., & Debattista, V. P. 2022, MNRAS, 516, 1114 [NASA ADS] [CrossRef] [Google Scholar]
- Laporte, C. F. P., Johnston, K. V., Gómez, F. A., Garavito-Camargo, N., & Besla, G. 2018, MNRAS, 481, 286 [Google Scholar]
- Laporte, C. F. P., Minchev, I., Johnston, K. V., & Gómez, F. A. 2019, MNRAS, 485, 3134 [Google Scholar]
- Li, Z.-Y., & Shen, J. 2020, ApJ, 890, 85 [NASA ADS] [CrossRef] [Google Scholar]
- Monari, G., Famaey, B., & Siebert, A. 2015, MNRAS, 452, 747 [NASA ADS] [CrossRef] [Google Scholar]
- Nandakumar, M., Narayan, C., & Dutta, P. 2022, MNRAS, 513, 3065 [NASA ADS] [CrossRef] [Google Scholar]
- Pedregosa, F., Varoquaux, G., Gramfort, A., et al. 2011, J. Mach. Learn. Res., 12, 2825 [Google Scholar]
- Power, C., Navarro, J. F., Jenkins, A., et al. 2003, MNRAS, 338, 14 [Google Scholar]
- Roca-Fàbrega, S., Valenzuela, O., Colín, P., et al. 2016, ApJ, 824, 94 [Google Scholar]
- Rocha, M., Peter, A. H., & Bullock, J. 2012, MNRAS, 425, 231 [NASA ADS] [CrossRef] [Google Scholar]
- Schönrich, R., & Dehnen, W. 2018, MNRAS, 478, 3809 [Google Scholar]
- Sellwood, J., & Debattista, V. P. 2022, MNRAS, 510, 1375 [Google Scholar]
- Semczuk, M., Łokas, E. L., D’Onghia, E., et al. 2020, MNRAS, 498, 3535 [NASA ADS] [CrossRef] [Google Scholar]
- Shen, J., & Sellwood, J. 2006, MNRAS, 370, 2 [NASA ADS] [CrossRef] [Google Scholar]
- Trelles, A., Valenzuela, O., Roca-Fábrega, S., & Velázquez, H. 2022, A&A, 668, A20 [NASA ADS] [CrossRef] [EDP Sciences] [Google Scholar]
- Tremaine, S., Frankel, N., & Bovy, J. 2023, MNRAS, 521, 114 [NASA ADS] [CrossRef] [Google Scholar]
- Turk, M. J., Smith, B. D., Oishi, J. S., et al. 2011, ApJS, 192, 9 [NASA ADS] [CrossRef] [Google Scholar]
- Urrejola-Mora, C., Gómez, F. A., Torres-Flores, S., et al. 2022, ApJ, 935, 20 [CrossRef] [Google Scholar]
- van de Voort, F., Davis, T. A., Kereš, D., et al. 2015, MNRAS, 451, 3269 [Google Scholar]
- Van Der Walt, S., Colbert, S. C., & Varoquaux, G. 2011, Comput. Sci. Eng., 13, 22 [Google Scholar]
- Weinberg, M. D. 1998, MNRAS, 299, 499 [Google Scholar]
- Weinberg, M. D., & Petersen, M. S. 2021, MNRAS, 501, 5408 [NASA ADS] [CrossRef] [Google Scholar]
- Widmark, A., Laporte, C. F. P., de Salas, P. F., & Monari, G. 2021, A&A, 653, A86 [NASA ADS] [CrossRef] [EDP Sciences] [Google Scholar]
- Widrow, L. M., Gardner, S., Yanny, B., Dodelson, S., & Chen, H.-Y. 2012, ApJ, 750, L41 [Google Scholar]
- Widrow, L. M., Barber, J., Chequers, M. H., & Cheng, E. 2014, MNRAS, 440, 1971 [Google Scholar]
- Williams, M. E. K., Steinmetz, M., Binney, J., et al. 2013, MNRAS, 436, 101 [Google Scholar]
Appendix A: Misalignment with the Z = 0 plane
The definition of a galactic plane is not a trivial task. Here we show how some stellar particles and gas are misaligned with respect to our choice of the Z = 0 plane, which is aligned with stellar particles at R < 7 kpc. Figure A.1 shows this misalignment, θ, for annular regions of 5 kpc of width from inner radii (top panel) to outer radii (bottom panel). In this reference system, those stellar particles at R < 5 kpc (top panel) are well aligned with the plane, with generally less than 1° of misalignment. At the external radii, both stars and gas are less aligned with this plane —especially in the first gigayear of the period studied— because of the disk being highly perturbed at these times.
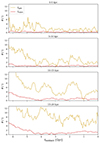 |
Fig. A.1. LZ misalignment of stars and gas with respect to the established Z = 0 plane in different radial regions. From top to bottom, regions from 0 to 5 kpc, 5 to 10 kpc, 10 to 15 kpc, and 15 to 20 kpc. |
Appendix B: Density and breathing modes
In this section, we apply the same algorithms described in the main article to study the density structures of the disk. In this case, the weights in Eq. 2 are the mass of each stellar particle. The Fourier decomposition is shown in Fig. B.1. In this figure, in m = 1, we observe a retrograde, one-armed spiral, whose phase (bottom left panel) becomes more coherent from 4 Gyr onward, and whose amplitude (top left panel) appears to be higher at radii > 7 kpc.
The origin of this density mode is unclear. At external radii, this mode seems to have existed since the beginning of our study, although at certain times (as discussed in previous sections) its amplitude seems to be higher. At radii where this amplitude is lower, the phase also becomes less clear and noisy. However, as its increases and decreases are not sudden, we do not see a clear link between this mode with other phenomena such as the passing of satellites. Our hypothesis is that, given that this structure has an important presence throughout the time span studied here, it is unlikely to be triggered by a single event, but instead by the structural density characteristics of the galactic system. In regard to the second Fourier mode (right panels), we see a difference between the inner and outer parts. The amplitude of the inner parts (< 4 kpc) is dominated by the central oval, and from 4 to 7 kpc periodic bisymmetric arms dominate. The intermediate and outer parts are at times dominated by the amplitude of mode m = 2, which could be related to spiral arms. In general, this mode propagates in the direction and periodicity of the rotation
In regard to the breathing modes in Fig. B.2, we observe that the amplitude is dominated by the Fourier mode m = 2, which stays approximately constant between 0 and 7 kpc of radius and increases at certain times in the intermediate and outer regions of the disk. Its phase shows a small oscillation over time, but overall this angle coincides with the position of the disk’s central oval, as described in Sect. 2. This is compatible with previous studies, where this breathing behavior is linked to the bar (Widrow et al. 2014; Faure et al. 2014; Monari et al. 2015; Carrillo et al. 2018).
Although weaker and noisier, the breathing mode m = 1 becomes more noticeable (top left panel) and with a more clearly defined phase (bottom panel) from the period of 2 to 0 Gyr. The studies by Widrow et al. (2014), Carrillo et al. (2018), Hunt et al. (2021) and Kumar et al. (2022) link the apparition of breathing modes in the disk with fast interaction with satellites. However, at these times, we do not have a fast (in terms of VZ) crossing, but instead, the satellite Escarabajo undergoes a slow interaction and reaches its pericenter at higher Z. Thus, the increase in breathing mode as a direct consequence of the interaction with Escarabajo is improbable.
Appendix C: Subhalos and dwarf galaxies as satellites
In this section, we show the pericentric moments of all satellites with > 106 M⊙ computed with the Rockstar halo finder. Figure C.1 shows the distance of the satellites to the center of the galaxy from less massive (top panel) to more massive ones (third panel). The bottom panel shows those galaxies with stellar particles.
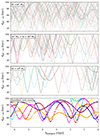 |
Fig. C.1. Distance of satellites to the center of the galaxy. The top panel shows dark satellites of 106 M⊙ < M < 107 M⊙. The second panel shows satellites of 107 M⊙ < M < 108 M⊙. The third panel shows satellites of M > 108 M⊙. The last panel shows all satellites with stellar mass. |
Appendix D: Correlations
In this work, we calculated the accelerations of the dark matter particles and gas. We characterized these in different regions using the Fourier mode m = 1, which is dominant in both cases at most times. We used the mean amplitude of this mode in regions from 0 to 10 kpc and 10 to 20 kpc. The same analysis was carried out with the variables tracing the vertical behavior of the disk, namely bending, breathing, and density modes. However, in this case, we also consider Fourier modes m = 2 for bending, breathing, and density.
To begin to understand the relationships between all these variables at all times, we define a moving window of 800 Myr of width, moving along in lookback time. At each snapshot, we define a window spanning from the previous 400 Myr to 400 Myr later. We calculate Pearson’s correlation coefficient r and its p-value at each window. As the pairs of variables are numerous, we present the results in three different figures. In Figs. D.1, D.2, and D.3 we present the correlation coefficient (lines), and the most notable correlations (where |r|> 0.4 and p-value < 0.05 circles).
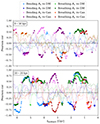 |
Fig. D.1. Pearson’s correlation coefficient in moving windows of 800 Myr in width for bending and breathing modes vs accelerations of gas and dark matter. Circles mark the moments where the Pearson’s coefficient fulfils |r|> 0.4 and p − value < 0.05 |
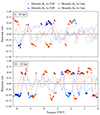 |
Fig. D.2. Same as Fig D.1 but with variables of density vs m = 1 of the acceleration applied by dark matter and gas. |
These figures serve as a visual aid to identify the moments at which different variables increase or decrease in relation to each other, and combined with Fig. 9, these can help us to better understand the causes and effects at play at the different time intervals discussed in Sect. 5. However, given to the small number of snapshots per window (average of 23 snapshots), we cannot extract accurate and definite conclusions based on these correlations on their own.
In the three figures, we observe that the first gigayear of the studied period presents high correlations between all variables due to the highly perturbed state of the galaxy and the subsequent relaxation over the next gigayear. We are especially interested in the correlations with the bending m = 1 at external radius starting at 2 Gyr, because it is the higher bending mode that we find over time and radius. In the bottom panel of Fig. D.1, we find a high correlation between this bending mode and the mode m = 1 of aZ applied by dark matter. We also find breathing modes being excited at these times, which also correlate with the acceleration by dark matter at these times.
From 2.2 Gyr until 1.6 Gyr, the density mode m = 1 correlates with the acceleration by dark matter and gas at more internal radii between 0 and 10 kpc (top panel of Fig. D.2, light blue and orange dots, respectively). At external radii (bottom panel of Fig. D2) there is no clear tendency. At these times and radii, in the top panel of Fig. D.3, we also see a correlation between the density mode m = 2 and the breathing mode m = 2 (dark green dots) and between the modes m = 1 of density and bending (light blue dots), which are also seen between 10 and 20 kpc.
All Tables
Main characteristics of the MW-sized model G.323 of GARROTXA simulation at z = 0.
All Figures
|
Fig. 1. Different structures of the stellar component of the snapshot at the present time z = 0. The left panel shows stars born 500 Myr after the last major merger (at 9.55 Gyr in lookback time). The panels in the central column show the older, hot disk. Finally, in the right column, we show the old stellar ellipsoid. The top two rows show the surface density of the stellar particles in the X–Z and X–Y projections, respectively. The last row shows the face-on projection colored by age. The disk rotates clockwise in this reference system. |
| In the text | |
|
Fig. 2. Overdensity plot of the disk particles with a Gaussian filter σ = 6 (top panel), bending (middle), and breathing (bottom) maps at two different snapshots of this simulation in each column, 2.33 Gyr and 0.99 Gyr in lookback time. A strong bending mode can be seen at 0.99 Gyr (middle right panel). |
| In the text | |
|
Fig. 3. Temporal evolution of the Fourier amplitude Am of the bending modes (top panels) and phase ϕm (bottom panels) of the m = 1 (left panels) and m = 2 (right panels) modes. The phase of mode m = 2 ranges between −90° and 90° because of the duplicity of the structures. The white horizontal dashed lines mark the division of the disk at radii of 10 and 20 kpc. The bending m = 1 dominates over m = 2 and shows higher amplitudes at outer radii (R > 7 kpc) excited mainly at the beginning of the studied time span and at later times from 2 Gyr onward. The inner parts show faster retrograde bending waves with the highest amplitude happening around 4 Gyr of lookback time. |
| In the text | |
|
Fig. 4. Vertical acceleration of dark matter (top panels) and gas (bottom panels). Black dot-dashed circles are situated at 20 kpc, illustrating the size of the stellar disk of the galaxy. The dark matter acceleration in the top three leftmost panels is dominated by the crossing of dark matter subhalos DM1119 and DM2595. The effect of gas at these times (bottom panels) is bimodal. The dark matter aZ of the right block of panels is dominated by the satellite galaxy “Escarabajo”, which applies positive aZ in the positive x – positive y region of the mesh. |
| In the text | |
|
Fig. 5. Fourier decomposition of the vertical acceleration by dark matter particles onto the Z = 0 plane. We show m = 1 (left panels) and m = 2, from which we have the amplitude of the mode (top panels) and the phase where the maximum amplitude is located (bottom panels). These are similar to Fig. 3, but extended to 40 kpc in radius. The inner acceleration is dominated by the inner dark matter structure. |
| In the text | |
|
Fig. 6. Total gravitational acceleration magnitude produced by each individual subhalo acting on the center of the galactic system (colored lines, right y-axis) and the sum of acceleration contributed by the remaining (less massive) subhalos (black dashed line, right y-axis). Subhalos containing stellar particles are indicated as solid lines, and those with pure dark matter are shown as dashed lines. We also marked the moments and positions (cylindrical radius, left axis) when the satellites (“x”) cross the galactic plane; those in gray correspond to the crossings of less massive satellites. Background color and left axis are equivalent to the top-left panel in Fig. 5. We note that, while the background color shows the vertical acceleration by all dark matter on the galactic plane Z = 0, lines show the total acceleration produced by subhalos at the galactic center, not at the Z = 0 plane. These latter contribute proportionally lower values of acceleration because of the difference in distance between the satellite and the closest point of the plane and the satellite and the center of the galaxy. For the lines, we also use the data regarding Mbound for each satellite, which id reevaluated at each apocenter. The masses indicated on the label are the first mass registered for each satellite, which corresponds to M200. In this figure, we see that the vertical acceleration from the dark matter halo between 25 and 40 kpc is correlated with the pericentric passages of several satellites, dark or luminous. The ones exerting more vertical acceleration are DM1119 and Escarabajo, as well as DM479 and DM2113 at later times. |
| In the text | |
|
Fig. 7. Fourier decomposition of the acceleration of the gas cells (similar to Fig. 5) onto the Z = 0 plane (galactic plane). We show m = 1 (left panels) and m = 2, from which we have the amplitude of the mode (top panels) and their corresponding phase of the maximum amplitude (bottom panels). |
| In the text | |
|
Fig. 8. Distribution and temperature of the gas in GARROTXA. Left and central columns: zoomed-out face-on (Y–X plane) and edge-on (Y–Z plane) projection of the gas temperature at six different instances of the simulation, color coded according to temperature. The crosses and dashed lines indicate the position and direction of the satellites Arania and Escarabajo. Right column: edge-on projection of the gaseous disk, color coded according to temperature. The dotted horizontal line represents the plane of the stellar disk. The main inflow is reaching the galaxy from the negative Y direction. |
| In the text | |
|
Fig. 9. Mean acceleration by the components of the simulations (dark matter and gas), tilting, and mean of the bending modes. Top left panel A: mean value of the amplitude of the Fourier mode m = 1 of aZ applied by the dark matter particles on the plane (blue lines) at external radii (20–40 kpc). The vertical lines show the moments of maximum approach to the disk by those satellites of higher mass, and the labels indicate their M200 at infall. The left panels show the calculated properties at radii from 10 to 20 kpc, whereas the right panels show these properties between 0 to 10 kpc. Panels B and F show the mean value of the amplitude of mode m = 1 of the vertical acceleration of dark matter (blue lines) and gas (orange lines). Panels C and G show the difference in angle between the angular momentum of stars and the angular momentum of gas (dotted orange lines, leftmost axis), and also the tilt of the central dark matter triaxial structure with respect to the disk (dotted blue lines rightmost axis), denoted by θgas and θellipsoid, respectively. Panels D and H show the angular momentum vector variation in relation to the previous snapshot divided by the time span. Panels E and I show the mean amplitude of Fourier amplitudes for bending modes m = 1 (green lines) and m = 2 (purple lines). |
| In the text | |
|
Fig. A.1. LZ misalignment of stars and gas with respect to the established Z = 0 plane in different radial regions. From top to bottom, regions from 0 to 5 kpc, 5 to 10 kpc, 10 to 15 kpc, and 15 to 20 kpc. |
| In the text | |
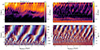 |
Fig. B.1. Similar to Fig. 3 but for the stellar mass. |
| In the text | |
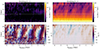 |
Fig. B.2. Similar to Fig. 3 but for the breathing modes. |
| In the text | |
|
Fig. C.1. Distance of satellites to the center of the galaxy. The top panel shows dark satellites of 106 M⊙ < M < 107 M⊙. The second panel shows satellites of 107 M⊙ < M < 108 M⊙. The third panel shows satellites of M > 108 M⊙. The last panel shows all satellites with stellar mass. |
| In the text | |
|
Fig. D.1. Pearson’s correlation coefficient in moving windows of 800 Myr in width for bending and breathing modes vs accelerations of gas and dark matter. Circles mark the moments where the Pearson’s coefficient fulfils |r|> 0.4 and p − value < 0.05 |
| In the text | |
|
Fig. D.2. Same as Fig D.1 but with variables of density vs m = 1 of the acceleration applied by dark matter and gas. |
| In the text | |
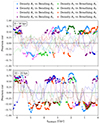 |
Fig. D.3. Same as Fig D.1 but with variables of density vs bending and breathing modes. |
| In the text | |
Current usage metrics show cumulative count of Article Views (full-text article views including HTML views, PDF and ePub downloads, according to the available data) and Abstracts Views on Vision4Press platform.
Data correspond to usage on the plateform after 2015. The current usage metrics is available 48-96 hours after online publication and is updated daily on week days.
Initial download of the metrics may take a while.