Fig. 8.
Download original image
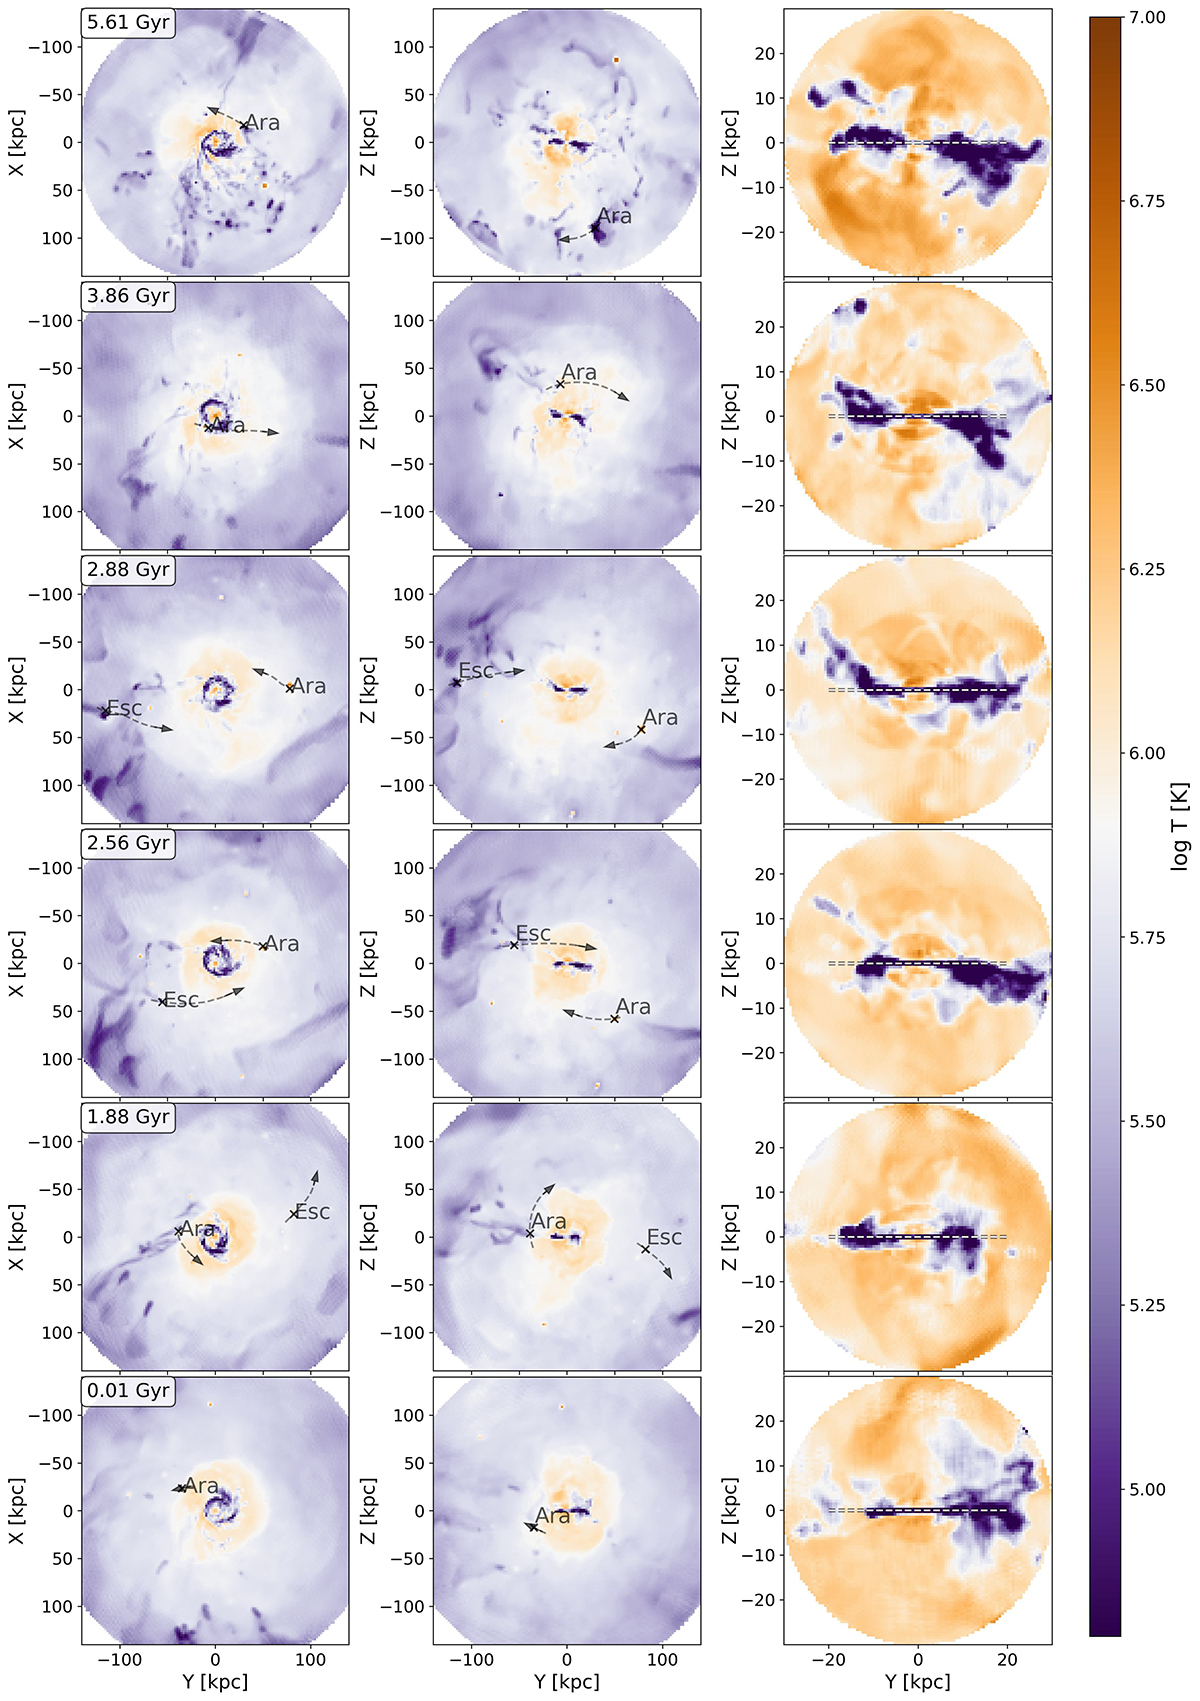
Distribution and temperature of the gas in GARROTXA. Left and central columns: zoomed-out face-on (Y–X plane) and edge-on (Y–Z plane) projection of the gas temperature at six different instances of the simulation, color coded according to temperature. The crosses and dashed lines indicate the position and direction of the satellites Arania and Escarabajo. Right column: edge-on projection of the gaseous disk, color coded according to temperature. The dotted horizontal line represents the plane of the stellar disk. The main inflow is reaching the galaxy from the negative Y direction.
Current usage metrics show cumulative count of Article Views (full-text article views including HTML views, PDF and ePub downloads, according to the available data) and Abstracts Views on Vision4Press platform.
Data correspond to usage on the plateform after 2015. The current usage metrics is available 48-96 hours after online publication and is updated daily on week days.
Initial download of the metrics may take a while.