Fig. 9.
Download original image
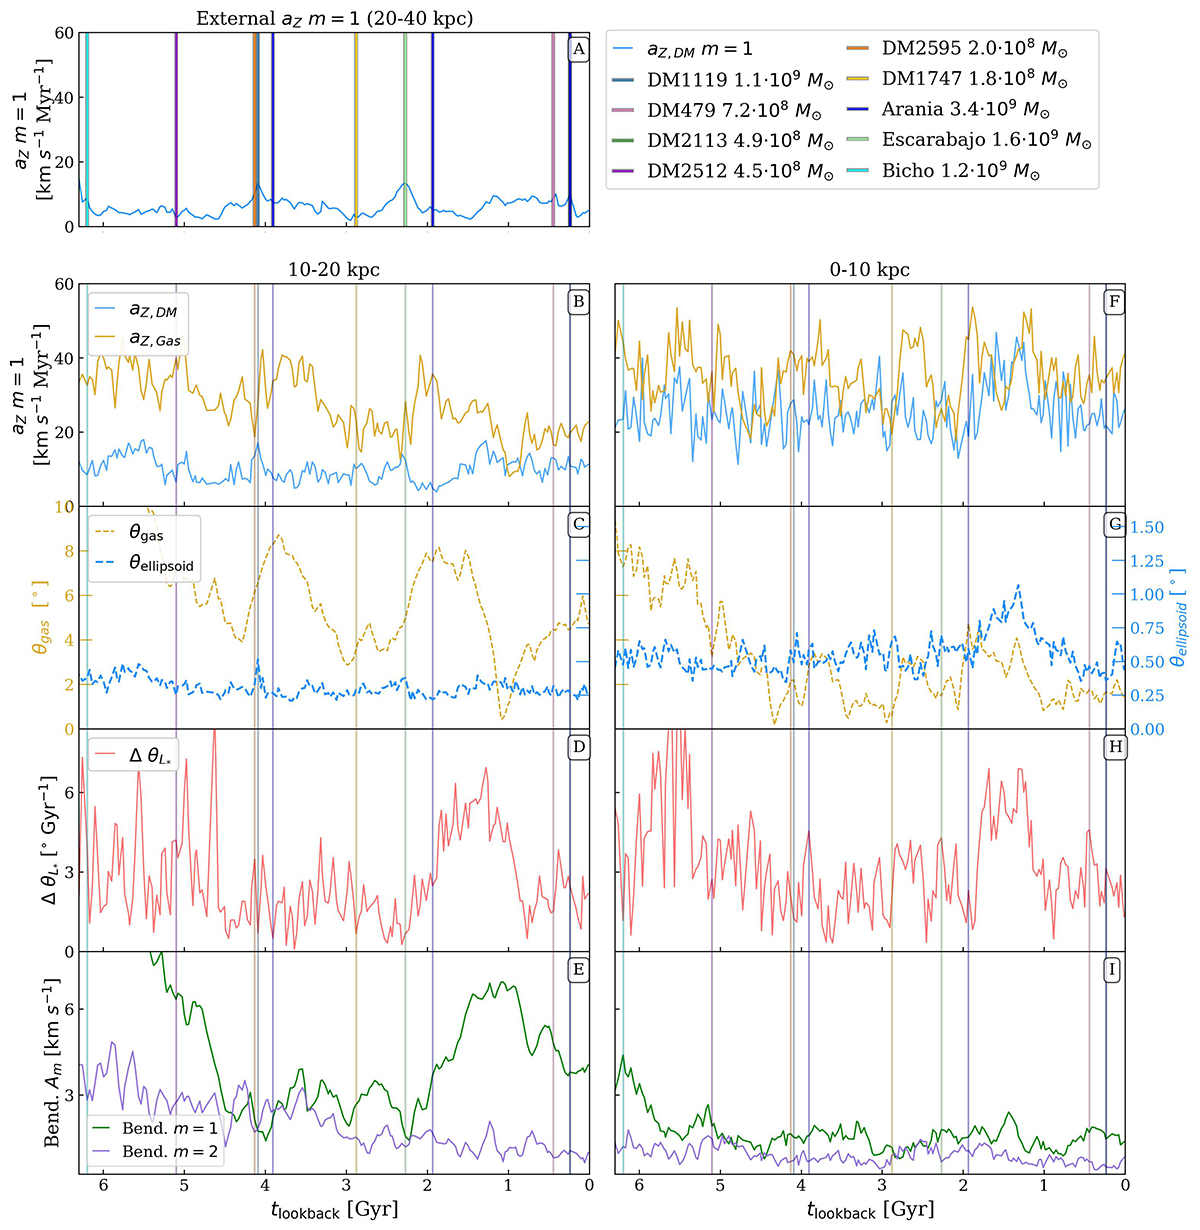
Mean acceleration by the components of the simulations (dark matter and gas), tilting, and mean of the bending modes. Top left panel A: mean value of the amplitude of the Fourier mode m = 1 of aZ applied by the dark matter particles on the plane (blue lines) at external radii (20–40 kpc). The vertical lines show the moments of maximum approach to the disk by those satellites of higher mass, and the labels indicate their M200 at infall. The left panels show the calculated properties at radii from 10 to 20 kpc, whereas the right panels show these properties between 0 to 10 kpc. Panels B and F show the mean value of the amplitude of mode m = 1 of the vertical acceleration of dark matter (blue lines) and gas (orange lines). Panels C and G show the difference in angle between the angular momentum of stars and the angular momentum of gas (dotted orange lines, leftmost axis), and also the tilt of the central dark matter triaxial structure with respect to the disk (dotted blue lines rightmost axis), denoted by θgas and θellipsoid, respectively. Panels D and H show the angular momentum vector variation in relation to the previous snapshot divided by the time span. Panels E and I show the mean amplitude of Fourier amplitudes for bending modes m = 1 (green lines) and m = 2 (purple lines).
Current usage metrics show cumulative count of Article Views (full-text article views including HTML views, PDF and ePub downloads, according to the available data) and Abstracts Views on Vision4Press platform.
Data correspond to usage on the plateform after 2015. The current usage metrics is available 48-96 hours after online publication and is updated daily on week days.
Initial download of the metrics may take a while.