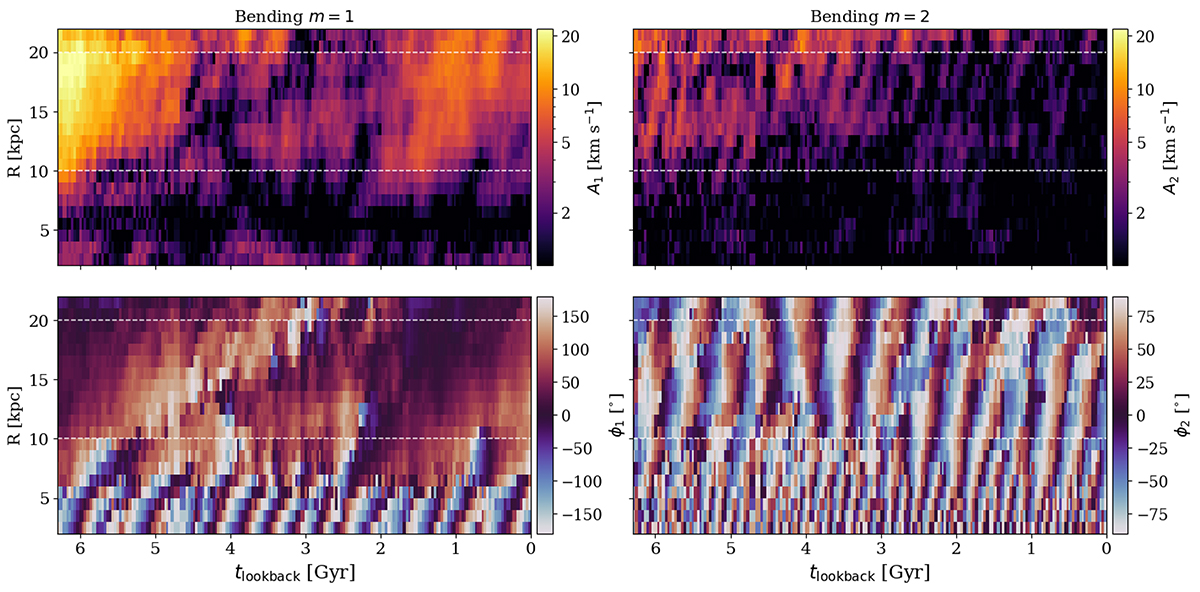
Fig. 3.
Download original image
Temporal evolution of the Fourier amplitude Am of the bending modes (top panels) and phase ϕm (bottom panels) of the m = 1 (left panels) and m = 2 (right panels) modes. The phase of mode m = 2 ranges between −90° and 90° because of the duplicity of the structures. The white horizontal dashed lines mark the division of the disk at radii of 10 and 20 kpc. The bending m = 1 dominates over m = 2 and shows higher amplitudes at outer radii (R > 7 kpc) excited mainly at the beginning of the studied time span and at later times from 2 Gyr onward. The inner parts show faster retrograde bending waves with the highest amplitude happening around 4 Gyr of lookback time.
Current usage metrics show cumulative count of Article Views (full-text article views including HTML views, PDF and ePub downloads, according to the available data) and Abstracts Views on Vision4Press platform.
Data correspond to usage on the plateform after 2015. The current usage metrics is available 48-96 hours after online publication and is updated daily on week days.
Initial download of the metrics may take a while.