Fig. 6.
Download original image
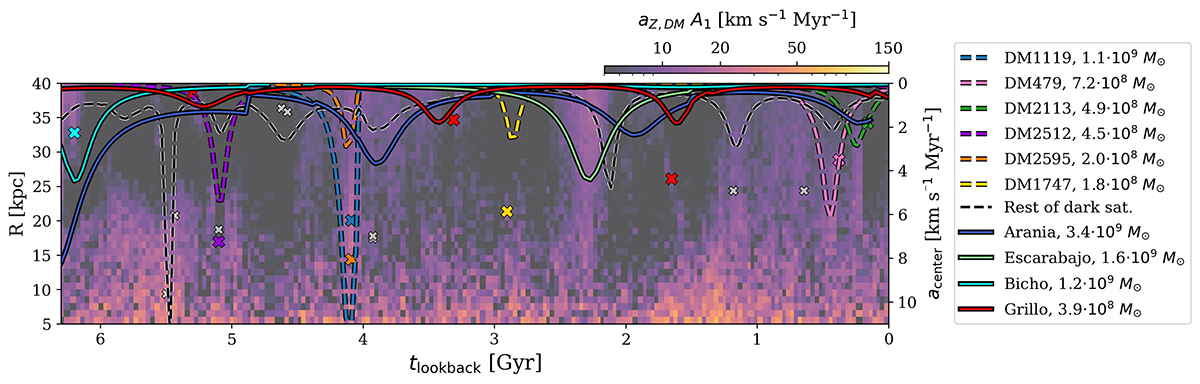
Total gravitational acceleration magnitude produced by each individual subhalo acting on the center of the galactic system (colored lines, right y-axis) and the sum of acceleration contributed by the remaining (less massive) subhalos (black dashed line, right y-axis). Subhalos containing stellar particles are indicated as solid lines, and those with pure dark matter are shown as dashed lines. We also marked the moments and positions (cylindrical radius, left axis) when the satellites (“x”) cross the galactic plane; those in gray correspond to the crossings of less massive satellites. Background color and left axis are equivalent to the top-left panel in Fig. 5. We note that, while the background color shows the vertical acceleration by all dark matter on the galactic plane Z = 0, lines show the total acceleration produced by subhalos at the galactic center, not at the Z = 0 plane. These latter contribute proportionally lower values of acceleration because of the difference in distance between the satellite and the closest point of the plane and the satellite and the center of the galaxy. For the lines, we also use the data regarding Mbound for each satellite, which id reevaluated at each apocenter. The masses indicated on the label are the first mass registered for each satellite, which corresponds to M200. In this figure, we see that the vertical acceleration from the dark matter halo between 25 and 40 kpc is correlated with the pericentric passages of several satellites, dark or luminous. The ones exerting more vertical acceleration are DM1119 and Escarabajo, as well as DM479 and DM2113 at later times.
Current usage metrics show cumulative count of Article Views (full-text article views including HTML views, PDF and ePub downloads, according to the available data) and Abstracts Views on Vision4Press platform.
Data correspond to usage on the plateform after 2015. The current usage metrics is available 48-96 hours after online publication and is updated daily on week days.
Initial download of the metrics may take a while.