| Issue |
A&A
Volume 683, March 2024
|
|
|---|---|---|
| Article Number | A10 | |
| Number of page(s) | 10 | |
| Section | Galactic structure, stellar clusters and populations | |
| DOI | https://doi.org/10.1051/0004-6361/202347420 | |
| Published online | 28 February 2024 | |
Young, wild, and free: The early expansion of star clusters
1
Department of Physics and Astronomy “Augusto Righi”, University of Bologna, Via Gobetti 93/2, 40129 Bologna, Italy
2
INAF – Astrophysics and Space Science Observatory of Bologna, Via Gobetti 93/3, 40129 Bologna, Italy
e-mail: This email address is being protected from spambots. You need JavaScript enabled to view it.
3
Department of Astronomy, Indiana University, Swain West, 727 E. 3rd Street, Bloomington, IN 47405, USA
Received:
10
July
2023
Accepted:
28
November
2023
Abstract
Early expansion plays a fundamental role in the dynamical evolution of young star clusters. However, until very recently most of our understanding of cluster expansion was based only on indirect evidence or on statistically limited samples of clusters. Here we present a comprehensive kinematic analysis of virtually all known young Galactic clusters (t < 300 Myr) based on the improved astrometric quality of the Gaia DR3 data. Such a large sample provides an unprecedented opportunity to robustly constrain the fraction of clusters and the timescale during which expansion has a prominent impact on the overall kinematics. We find that a remarkable fraction (up to 80%) of clusters younger than ∼30 Myr is currently experiencing significant expansion, whereas older systems are mostly compatible with equilibrium configurations. We observe a trend in which the expansion speed increases with the cluster-centric distance, suggesting that clusters undergoing expansion will likely lose a fraction of their present-day mass. Also, most young expanding clusters are extended, possibly due to the expansion itself. A comparison with a set of N-body simulations of young star clusters shows that the observed expansion pattern is in general qualitative agreement with that found for systems undergoing violent relaxation and evolving toward a final virial equilibrium state. However, we also note that additional processes likely associated with residual gas expulsion and mass loss due to stellar evolution likely also play a key role in driving the observed expansion.
Key words: astrometry / stars: formation / stars: kinematics and dynamics / open clusters and associations: general / galaxies: star clusters: general
© The Authors 2024
 Open Access article, published by EDP Sciences, under the terms of the Creative Commons Attribution License (https://creativecommons.org/licenses/by/4.0), which permits unrestricted use, distribution, and reproduction in any medium, provided the original work is properly cited.
This article is published in open access under the Subscribe to Open model. This email address is being protected from spambots. You need JavaScript enabled to view it. to support open access publication.
1. Introduction
It is commonly accepted that most Galactic star formation takes place in embedded protoclusters as a result of turbulent, clumpy, and stochastic processes in molecular clouds (e.g., Lada & Lada 2003; Offner et al. 2009; Feigelson et al. 2013). The environments in which stars form determine to some extent a number of key properties that characterize the stellar clusters we observe today, such as their initial mass function, the stellar multiplicity, and the star-by-star chemical abundance differences routinely observed in massive stellar clusters (e.g., Bastian & Lardo 2018; Gratton et al. 2019; Milone & Marino 2022).
In recent years there has been renewed interest in the theoretical and observational study of the formation of stellar clusters. Particular attention has been paid to the very early evolutionary phases, when clusters are expected to undergo violent relaxation and be evolving toward a virial equilibrium state. Studies of clusters’ formation and very early evolution have shown that clusters can emerge from these evolutionary phases with internal rotation, radial anisotropy in the velocity distribution, and mass segregation. However, the detailed role of the various physical processes involved and the variety of different dynamical paths are still a matter of intense investigation (see, e.g., McMillan et al. 2007; Allison et al. 2009; Moeckel & Bonnell 2009; Pfalzner & Kaczmarek 2013; Banerjee & Kroupa 2014; Vesperini et al. 2014; Fujii & Portegies Zwart 2016; Parker et al. 2016; Domínguez et al. 2017; Mapelli 2017; Daffern-Powell & Parker 2020; González-Samaniego & Vazquez-Semadeni 2020).
Furthermore, the clusters’ early evolutionary phases have been only poorly constrained by observations, mainly due to the difficulty of obtaining reliable kinematic information for statistically significant samples of cluster members. Data from the Gaia space mission, in particular its third data release (DR3; Gaia Collaboration 2023), provided the deepest and most precise astrometric catalog ever obtained and made possible new studies on star cluster formation and dynamics. Indeed, Gaia’s unprecedented kinematical mapping of the Galaxy and of its stellar components has significantly enriched our knowledge of the number and properties of star clusters in the Milky Way (see, e.g., Cantat-Gaudin et al. 2020; Cantat-Gaudin & Anders 2020). It has also enabled detailed studies of nearby star-forming regions and their use as ideal laboratories to shed new light on cluster formation and early evolution (e.g., Beccari et al. 2018; Kuhn et al. 2019; Meingast & Alves 2019; Dalessandro et al. 2021; Della Croce et al. 2023).
The evolution of a young cluster depends on many physical factors, such as the cluster’s structural properties (e.g., mass and size), the strength of the external tidal fields, and their physical and dynamical ages (see, e.g., Hills 1980; Parker et al. 2014; Sills et al. 2018). Early cluster expansion is expected to play a fundamental role in cluster evolution and drive stellar systems toward complete dissolution (Elmegreen 1983; Mathieu 1983; Adams 2000; Kroupa 2001; Goodwin & Bastian 2006; Pelupessy & Portegies Zwart 2012; Dinnbier & Kroupa 2020; Dinnbier et al. 2022; Farias & Tan 2023). Theoretical studies show that cluster expansion due to processes such as gas expulsion and the subsequent violent relaxation phase may last several megayears, depending on many cluster properties, including the cluster dynamical state at the expulsion, the specific star-formation efficiency, and the cluster size, density, and mass (Kroupa et al. 2001; Baumgardt & Kroupa 2007; Pelupessy & Portegies Zwart 2012; Banerjee & Kroupa 2013; Pfalzner & Kaczmarek 2013; Brinkmann et al. 2017; Farias et al. 2017; Farias & Tan 2023; Li et al. 2019; Pang et al. 2021; Leveque et al. 2022). Eventually, the system can either settle into equilibrium, after losing some mass during expansion, or dissolve completely. The subsequent long-term evolution of surviving clusters will be driven by two-body relaxation and the interplay between the effects of internal evolution and the external Galactic tidal field (see, e.g., de La Fuente Marcos 1997; Hurley et al. 2005).
However, evidence of cluster expansion has been hard to derive directly, and until very recently most of our understanding has been based on indirect evidence resulting from cluster size−density or density−age anticorrelations (e.g., Pfalzner et al. 2014; Getman et al. 2018). Thanks to Gaia data, we are now able to directly probe expansion in star-forming regions and young star clusters with unprecedented detail (Cantat-Gaudin et al. 2019a,b; Román-Zúñiga et al. 2019; Damiani et al. 2019; Wright et al. 2019; Lim et al. 2020, 2021, 2022; Buckner et al. 2020; Armstrong et al. 2020, 2022; Schoettler et al. 2020, 2022; Kuhn et al. 2020; Swiggum et al. 2021; Maíz Apellániz et al. 2022; Miret-Roig et al. 2022; Guilherme-Garcia et al. 2023).
In particular, Kuhn et al. (2019) studied the kinematical properties of a sample of 28 young clusters (1 − 5 Myr) and associations by using Gaia Data Release 2 (DR2) proper motions. According to those authors, observations are consistent with early cluster expansion driven by changes in the gravitational potential due to the dispersal of the molecular cloud. More recently, Guilherme-Garcia et al. (2023) investigated the kinematics of 1237 clusters using a technique that aims at reconstructing the underlying velocity field. They found 8 clusters that display rotation patterns (and an additional 9 candidates) and 14 clusters that show evidence of expansion in their velocity fields (and 15 candidates; Guilherme-Garcia et al. 2023). The vast majority of the expanding systems in their sample are younger than 100 Myr, with a peak around 10 Myr. While these studies provided important clues about the early evolution and survival of young clusters, the availability of more precise data from Gaia DR3 and the possibility to assess cluster membership more robustly would allow us to disentangle critical aspects related to their evolution.
In this work we present a comprehensive and systematic analysis of the kinematic properties of (virtually) all young stellar clusters (t < 300 Myr) identified so far in the Milky Way (using the cluster catalog from Cantat-Gaudin & Anders 2020; Cantat-Gaudin et al. 2020), with a particular focus on the early cluster expansion phase. Such a large sample provides an unprecedented opportunity to robustly constrain the timescale during which expansion has a prominent impact on the overall cluster kinematics. Also, it allows us to trace how expansion affects or is linked to the cluster properties and formation mechanisms.
The paper is organized as follows. In Sect. 2 the cluster membership determinations and kinematic analyses are described. We present our results in Sect. 3, and we compare them with numerical simulations in Sect. 4. We assess the impact of different age estimates on our results in Sect. 5, and a detailed comparison with previous works is presented in Sect. 6. Finally, conclusions are drawn in Sect. 7.
2. Data analysis
2.1. Clusters’ membership
The present work makes use of the list of clusters identified by Cantat-Gaudin et al. (2020) using Gaia DR2 data. We focused on systems younger than ≤300 Myr (according to age estimates by Cantat-Gaudin et al. 2020) to investigate the evolution of star clusters in their very early stages. In this way, we selected 1179 clusters out of 2017 in the original catalog.
To take full advantage of the most recent and accurate Gaia DR3 data release for the definition of cluster member stars, we performed an independent membership analysis. For every cluster, we retrieved Gaia DR3 data for sources brighter than G = 18 and that have a five-parameter solution (i.e., with sky position, proper motions, and parallax measurements). In particular, every query was centered on the cluster’s centroid (as reported by Cantat-Gaudin et al. 2020) and the search radius was defined as Rsearch, sky ≡ 2R95, sky, where R95, sky is the radius enclosing 95% of the member stars reported by Cantat-Gaudin et al. (2020).
For each cluster, we then selected stars according to their motion with respect to the cluster’s bulk motion. Only sources within Rsearch, PM ≡ 2 R95, PM, with R95, PM being a circle in proper motion space that encloses 95% of the members, were retained in the subsequent analysis. We did not apply any preliminary parallax selection. These selections allowed us to include all the previously listed members in our starting Gaia DR3 catalog.
We performed the clustering analysis in the five-dimensional space of Galactic coordinates, proper motions, and parallax (i.e., ℓ, b, μα*, μδ, and ϖ). Since we are dealing with heterogeneous quantities, we preliminary scaled them all, so that the mean and standard deviation of their distributions are equal to zero and one, respectively. We used the StandardScaler provided by the Python library sklearn. We then performed an unsupervised clustering analysis on the scaled coordinates by means of the HDBSCAN (McInnes et al. 2017; McInnes & Healy 2017) algorithm.
Based on the results of several tests, we set the algorithm’s parameters as follows:
 (1)
(1)
and
 (2)
(2)
where NCG20 is the number of member stars reported by Cantat-Gaudin et al. (2020). These parameters appeared to be best suited for the unsupervised search for members in star clusters characterized by significantly different extensions (Rsearch, sky), velocity distributions (Rsearch, PM) and number of likely members (NCG20).
As a test case, in Fig. 1 we show the spatial, parallax, proper motion, and color-magnitude diagram (CMD) distributions for the selected members of ASCC 113. As expected, selected member stars are clustered in the five-dimensional astrometric space (i.e., ℓ; b; ϖ; μα*; μδ). Also, they exhibit a well-defined, cluster-like sequence in the CMD, thereby confirming the ability of our clustering analysis to recover stellar cluster members among field stars.
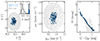 |
Fig. 1. Astrometric and photometric properties of ASCC 113 members (shown in blue). In gray we show the properties of the initial sample of Gaia sources (see Sect. 2.1). The left panel shows the distributions in Galactic coordinates and parallax (top-right corner), the middle panel the proper motion (PM) distribution, and the right panel the CMD. The parallax distributions were scaled for visualization purposes only. |
While running the procedure for all the clusters in the sample, we found that the algorithm performed poorly on clusters with only a few member stars (NCG20 < 30). This is probably due to the choice of min_cluster_size, which sets a lower limit to the number of member stars in our search for star clusters. However, since the kinematic analysis strongly benefits from the availability of relatively large samples of individual velocities, we decided to exclude these clusters from our analysis. In this way, we ended up with a final sample of 949 clusters for which the clustering analysis was performed.
Figure 2 shows a direct comparison between the number of member stars obtained by using Gaia DR3 and that found by Cantat-Gaudin et al. (2020). While some differences are expected due to the different adopted clustering algorithms and Gaia data releases, Fig. 2 shows an overall agreement between the two compilations.
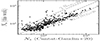 |
Fig. 2. Comparison of member stars between this work and Cantat-Gaudin et al. (2020, NGC + 20) for all the clusters included in the analysis. Diagonal lines show the one-to-one relation and the relations corresponding to half and twice the members (as also reported in the plot). |
2.2. Cluster kinematic analysis
First, we accounted for perspective effects induced by the cluster bulk motion following the equations reported by van Leeuwen (2009). To this aim, systemic line-of-sight (LOS) velocities from Tarricq et al. (2021) were used. Only 509 out of 949 clusters (see Sect. 2.1) had reported LOS velocity and were thus retained in the subsequent analysis.
In Fig. 3 we compare the age distributions within 300 Myr of the original catalog and the final sample of clusters. The distributions populate the investigated age range in a similar fashion and our final sample of 509 clusters is representative of the initial age distribution.
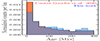 |
Fig. 3. Age distributions for clusters in the starting catalog (in red, Cantat-Gaudin et al. 2020) and those retained in the kinematic analysis (in blue). Histograms were normalized such that their areas sum to unity. |
We then used stars with a membership probability larger than 70% based on the clustering analysis performed in this work (Sect. 2.1). We also selected cluster members with ruwe ≤1.4, astrometric_gof_al ≤1, and astrometric_excess_noise ≤1 mas (if astrometric_excess_noise_sig > 2), thus excluding stars for which the standard five-parameter solution did not provide a reliable fit of the observed data (Lindegren et al. 2021).
We inferred the mean radial velocity, ⟨vR⟩, and the radial velocity dispersion, σR, in a fully Bayesian framework properly accounting for errors on individual velocities. We explored the parameters space employing a Markov chain Monte Carlo (MCMC) technique. In particular, we used the Python package emcee (Foreman-Mackey et al. 2013). For each system, we assumed the likelihood (Pryor & Meylan 1993)
![Mathematical equation: $$ \begin{aligned} \ln \mathcal{L} = -0.5\sum _{\rm k}\left[ \frac{(v_{\rm R,k} - \langle v_{\rm R}\rangle )^2}{\delta v^2_{\rm R,k} + \sigma ^2_{\rm R}} + \ln (\delta v^2_{\rm R,k} + \sigma ^2_{\rm R}) \right], \end{aligned} $$](/articles/aa/full_html/2024/03/aa47420-23/aa47420-23-eq3.gif) (3)
(3)
with vR, k and δvR, k being the radial velocity and the respective error of the kth member. Equation (3) assumes that the intrinsic distribution along the radial component of the velocity is a Gaussian with mean ⟨vR⟩ and velocity dispersion σR. We used uniform priors within [ − 10; +10] mas yr−1 and [0.001; 15] mas yr−1 for ⟨vR⟩ and σR, respectively. For each cluster, we initialized 50 walkers and ran the algorithm for 500 steps, which was found to be sufficient for both ensuring convergence (for which the first half of samples was discarded) and accounting for correlations between samples (typically on the order of 20). Median values and 16% and 84% quantiles (corresponding to the 1σ interval if the distributions were Gaussian) were then computed for each quantity directly from posterior samples. The kinematical analysis was performed by adopting the clusters’ geometric center, defined as the median of the positions of member stars.
3. Results
Figure 4 shows the ratio between the mean radial velocity and the radial velocity dispersion (hereafter ⟨vR⟩/σR) as a function of clusters’ ages from Cantat-Gaudin et al. (2020). This quantity provides an indication of the amplitude of the ordered to the disordered motion of stars along the radial component, thus directly tracing ongoing expansion or contraction. A positive value of ⟨vR⟩/σR implies expansion.
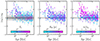 |
Fig. 4. Ratio between the mean radial velocity and the radial velocity dispersion for clusters younger than 300 Myr (according to Cantat-Gaudin et al. 2020). Errors on the y-axes were obtained directly from the MCMC samples, and ages are from Cantat-Gaudin et al. (2020). In the left panel, clusters are color-coded according to the number of members. The standard deviation (and twice the value) of the ⟨vR⟩/σR ratio obtained from numerical realizations of equilibrium star clusters (see Sect. 4.2) are shown as gray-shaded areas. Values obtained from numerical realizations were convolved with the median observational error to allow for a direct comparison with the underlying data. In the middle panel, colors depict R50, whereas in the right panel, the color coding represents the ratio between the slope and the corresponding error from the linear regression of radial velocities as a function of cluster-centric distance. |
The first key result highlighted by Fig. 4 is that about 80% of clusters younger than ∼30 Myr show positive ⟨vR⟩/σR values. More in general, the total fraction of young (< 30 Myr) systems having positive ⟨vR⟩/σR at the 3σ level is 43%. The distribution attains maximum values ⟨vR⟩/σR = 1.5 − 2 (such clusters typically have ⟨vR⟩∼2 km s−1) for clusters with age ∼10 Myr. Then it progressively decreases. For clusters older than ∼30 Myr, the distribution of ⟨vR⟩/σR flattens around 0 and it shows an intrinsic standard deviation of about 0.2 (corresponding to ⟨vR⟩≲0.1 km s−1). Such a clear trend allows us to identify for the first time the timescale (of about 30 Myr) during which expansion plays a significant role in the overall cluster kinematics. We verified that these results do not change significantly if different age estimates were adopted (see Sect. 5).
In the left panel of Fig. 4 clusters are color-coded according to the number of member stars. We note that the amplitude of the scatter around zero observed in systems older than 30 Myr strongly depends on the number of members identified. Results of numerical experiments of equilibrium stellar clusters (see Sect. 4.2) suggest that the observed spread around zero can be largely explained in terms of statistical fluctuations due to a low number of stars (gray shaded area in Fig. 4). This in turn confirms that the distribution observed for older clusters is consistent with what is expected for systems in equilibrium.
Most of the young (< 30 Myr) clusters with clear ongoing expansion are characterized by some of the largest values (up to ∼10 pc) of R50 (Fig. 4, middle panel). We note that among the expanding systems, those with smaller R50 values preferentially attain smaller ⟨vR⟩/σR by up to a factor of 2. Finally, the old expanding clusters (> 30 Myr) typically have fewer members and greater extensions, suggesting that they might have been expanding for several tens of megayears.
Furthermore, we performed a linear fit to the distribution of vR as a function of the cluster-centric distance for each cluster and we derived the angular coefficient m and its relative error σm. Interestingly, we found that the majority of the expanding clusters show a positive and significant (m/σm ≥ 3) ranking in their vR distributions as a function of their positions in the cluster (see the right panel of Fig. 4). These patterns could suggest that young expanding clusters are likely losing a fraction of their original mass as stars in the outskirts become unbound. However, we note in passing that this does not necessarily imply that all the expanding clusters will become unbound. In fact, stars in the external regions moving away from the cluster can produce a positive slope even if the inner parts are not expanding.
Finally, we present the kinematic properties of a few prototypical systems in Fig. 5. We selected two young (< 30 Myr) clusters, namely NGC 6193 and NGC 4103, and two older systems, LP 2219 and NGC 3114. Within each group, we picked one system showing significant evidence of expansion (NGC 6193 and LP 2219), whereas the other one is compatible with equilibrium (NGC 4103 and NGC 3114). Relevant cluster properties are reported in Table 1 for reference.
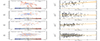 |
Fig. 5. Kinematic properties of NGC 6139, NGC 4103, LP 2219, and NGC 3114 (from top to bottom). The left panels show the spatial distribution of members in Cartesian coordinates normalized to the radius enclosing half of the members, with arrows showing the velocity vectors on the plane of the sky. The arrow lengths are proportional to the speed on the plane of the sky (velocity scale reported in the top-right corners), while their colors map the radial component (vR) of the velocity. Positive values point outward. The right panels show the distribution of members in the vR − R plane. The linear regressions of velocities as a function of the cluster-centric distances are shown (orange lines), as are the posterior values on the slopes (at the bottom). |
In particular, the left panels of Fig. 5 show the spatial distribution of members used to compute ⟨vR⟩/σR (see Fig. 4), as well as the velocity vectors on the plane of the sky. Arrow lengths are proportional to their total speeds whereas the color coding traces the amplitude of the radial velocity component (Fig. 5). Right panels, on the other hand, show the distribution of individual velocities as a function of the cluster-centric distance. The linear regression used to obtain the m/σm parameter (see Fig. 4) is also shown and the value of the slope is reported. To ease the comparison, spatial coordinates are scaled to R50 for each cluster, and their velocities are shown in the same velocity scale.
Expanding clusters (NGC 6193 and LP 2219) show a preferential alignment of velocity vectors along the positive (i.e., pointing outward) radial direction, as highlighted by the color coding (Fig. 5). This feature is particularly evident in the external regions. A clear trend is also observed in vR versus R distribution, and it is reflected in the positive value of the slope from the linear regression (as already pointed out in Fig. 4).
Non-expanding clusters (NGC 4103 and NGC 3114), on the other hand, present radial velocities that are scattered around zero, without any preferential alignment along the radial direction or significant radial trend. All these features are consistent with the systems being in equilibrium.
Lastly, we looked for any dependence of the expansion properties on the cluster masses. In particular, we crossmatched our cluster catalog with the recent compilation of cluster masses provided by Almeida et al. (2023). We found 227 clusters in common. For those clusters, we show ⟨vR⟩/σR as a function of cluster age, color-coded according to the mass reported by Almeida et al. (2023, see Fig. 6 in this work). Qualitatively, expansion affects clusters of any mass, from about 102 M⊙ to a few times 103 M⊙. To elaborate more on this point, we split the population of clusters younger than 30 Myr (45 clusters) into two subsamples: expanding (27 clusters, about 60% of the sample) and non-expanding clusters (18 out of 45 systems, i.e., 40%). For the purpose of this analysis, we classified a cluster to be expanding if the expansion signal is significant at the 1σ level. The only purpose here is to obtain two almost equally populated samples of clusters. We then compared the mass distribution of the two subpopulations with each other and with the full sample of young clusters. A Kolmogorov–Smirnov test shows that there is no significant statistical difference between the three populations. Although based on a few dozen clusters, this result suggests that the physical processes driving the expansion of star clusters in their early stages of formation and evolution are effective irrespective of the cluster mass.
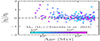 |
Fig. 6. Distribution of ⟨vR⟩/σR as a function of the age for the 227 clusters in common with Almeida et al. (2023). The color coding depicts the cluster mass, Mcl. |
4. Comparison with numerical simulations
4.1. N-body simulations of cluster formation
In this section, we present a brief analysis of a few N-body simulations of young star clusters undergoing the violent relaxation phase and evolving toward their final virial equilibrium state. The goal here is to illustrate the time evolution of their global expansion pattern and establish a general connection with the observational results presented in the previous sections. The simulations considered here are part of the suite discussed in detail in Livernois et al. (2021) who explored the early evolution of systems starting with the homogeneous or fractal spatial distribution and investigated the role of initial rotation on the cluster’s early evolutionary phases. Here we focus on four models: two models with homogeneous initial spatial distributions, one without and one with rotation (hereafter referred to as H0 and H075, respectively; see Livernois et al. 2021, for further details about the initial conditions) and two models with an initial fractal spatial distribution without and with the initial rotation (hereafter F0 and F025). Figure 7 shows the time evolution of ⟨vR⟩/σR for the selected models as obtained by using all stars in the system within the tidal radius. All models show an initial contracting phase followed by significant expansion. The initially homogeneous models display more rapid and extreme collapse and expansion phases than the initially fractal models as the clumps within these models merge and interact with other clumps before arriving at the center of the system Although these specific models do not reach the extreme values of ⟨vR⟩/σR found in our study (Fig. 4), the range of expansion values found in these simulations spans those attained by most of the observed clusters, thus suggesting that violent relaxation can play a key role in triggering and driving early cluster expansion. We emphasize that the idealized models presented here are included just to illustrate the general kinematic behavior during these early evolutionary phases and they are not meant to provide a detailed fit to the observational data. Different initial conditions and more realistic simulations including additional processes such as gas expulsion and mass loss due to stellar evolution might be necessary to reach the most extreme values found in the observational sample and to constrain the range of timescales of the early expansion, of the settling to the final equilibrium as well as the timescale associated with the possible cluster’s dissolution. We note also that the theoretical lines shown in Fig. 7 represent the evolutionary path of the ⟨vR⟩/σR ratio of clusters surviving the early evolutionary phases. We point out that it is likely that not all the clusters with age < 30 Myr in the observational sample will follow this path as some of them will continue expanding and will eventually dissolve.
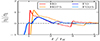 |
Fig. 7. Time evolution of the ratio between the mean radial velocity and the radial velocity dispersions for a selection of models from Livernois et al. (2021) for all stars within the tidal radius. |
4.2. Distribution of ⟨vR⟩/σR for star clusters in equilibrium
The results presented in Fig. 4 suggest that, for t > 30 Myr, the distribution of the ⟨vR⟩/σR is compatible with what is expected for clusters in equilibrium and that the broadening of the distribution might be mostly driven by statistical fluctuations.
To check whether this is indeed the case, we created 100 random realizations of a population of clusters. Each population contains the same number of clusters as in our observed sample and in each realization the clusters have the same number of stars as in the observed sample. Positions and velocity of stars in each cluster follow those of a King model with central dimensionless potential W0 = 5 (but the results do not have any significant dependence on the particular model adopted). For each realization, we then calculated the dispersion in the distribution of the values of ⟨vR⟩/σR of the clusters in the sample. The average value of the dispersion found in the 100 realizations is equal to about 0.11 and is shown as a gray-shaded area in Fig. 4. The comparison demonstrates that (1) the spread observed for older systems can be largely accounted for by statistical fluctuations and (2) equilibrium models cannot account for large positive ⟨vR⟩/σR (i.e., expansion) observed in clusters with t < 30 Myr and that those systems are therefore out of equilibrium.
We note, however, that the observed spread is larger (about a factor of 2) than that derived from the simulations. While these residuals might suggest that some of the clusters older than ∼30 Myr are still oscillating around equilibrium configurations, it is important to emphasize that in the analysis of the ⟨vR⟩/σR from the numerical realizations of cluster populations, not all the possible effects that can determine the spread of this quantity are included. They do not account, for example, for a number of possible uncertainties associated with the observational data such as the uncertainties induced by wrong LOS systemic velocities (mainly due to low-number statistics). Further investigation is needed to properly study this issue.
5. Testing the impact of different age estimates on the expansion pattern
The reference age compilation adopted in this analysis is the one by Cantat-Gaudin et al. (2020). Here we test the robustness of our results against different compilations of clusters ages from literature. In particular, we used cluster ages obtained by Kharchenko et al. (2013), Bossini et al. (2019), and Dias et al. (2021) determined ages for several star clusters in our Galaxy through isochrone fitting. We note that Kharchenko et al. (2013) exploited pre-main-sequence stars as a further age indicator to obtain more reliable ages in the young end. Hunt & Reffert (2023), performed an all-sky search for open clusters and they provided ages for every cluster in their sample obtained by means of a convolutional neural network. We crossmatched the sample of 509 clusters adopted in this study with these catalogs.
Figure 8 shows the distribution of ⟨vR⟩/σR as a function of age (as in Fig. 4) for the clusters in common with the four compilations. Also, in Table 2 we report the fractions (as well as the total numbers) of clusters exhibiting evidence (at the 3σ level) of expansion in different age bins. Although different catalogs span different age ranges for the same clusters, the trend of expanding clusters for ages below ≃30 Myr is clearly visible in all the catalogs. This test demonstrates that the results presented in the manuscript are robust against different age estimates, also in terms of timescale during which expansion has an important role in cluster kinematics.
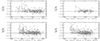 |
Fig. 8. Mean radial velocity to radial velocity dispersion ratio as a function of cluster age for different age estimates (from left to right): Kharchenko et al. (2013), Bossini et al. (2019), Dias et al. (2021), and Hunt & Reffert (2023). Errors on the y-axis are obtained from the MCMC sampling of the posterior, while those on the x-axis (if present) are age errors provided by the different catalogs. The zero-level expansion is marked by the dark dashed line. |
Fraction of expanding clusters.
6. Comparison with previous works
Kuhn et al. (2019) investigated the expansion properties of twenty-eight stellar clusters and associations, concluding that at least 75% of clusters in their sample are expanding. Among the clusters in common, we find a significant expansion for NGC 1893, NGC 2244, and NGC 2362 and a mild expansion for IC 348 and NGC 6231, consistent with the results by Kuhn et al. (2019) for these systems.
Recently, Guilherme-Garcia et al. (2023) investigated the internal kinematics of many open clusters. In particular, they identified expansion in 14 clusters with 15 more candidates. Among the 14 expanding clusters, 5 were not included in our study, namely Alessi 13, Aveni Hunter 1, Collinder 132 (as they have fewer than 30 members in our catalog; see Sect. 2.1), Ruprecht 98, and Stock 1 (as they are older than 300 Myr according to Cantat-Gaudin et al. 2020). For all the others, we confirm their state of significant expansion, with the only exception of BH 164, for which we derived  . Among the 15 candidates, according to our analysis we confirm that IC 1805 (
 ), Roslund 2 (
 ), Trumpler 16 (
 ), and vdBergh 92 (
 ) are expanding, whereas ASCC 127 (
 ), and BH 99
  are not. In addition to differences in specific systems, we note that in our analysis we found a significantly larger sample of expanding clusters than Guilherme-Garcia et al. (2023). This is probably due to different approaches and membership probabilities that are based on Gaia DR3 data (Sect. 2.1) in our case and DR2 in the case of Guilherme-Garcia et al. (2023).
Besides dedicated studies (such as Kuhn et al. 2019; Guilherme-Garcia et al. 2023), evidence of expansion was found in several works. For instance, Bravi et al. (2018) investigated the kinematical properties of four young (≳30 Myr) open clusters, namely IC 2602, IC 2391, IC 4665, and NGC 2547. They found that all the clusters but IC 4665 (for which they only put an upper limit) are super virial, concluding that this is consistent with the residual gas expulsion scenario. Clusters indeed expand eventually returning to an equilibrium state after unbound stars are dispersed. This process might take several tens of system crossing times (Baumgardt & Kroupa 2007). Consistently, we found that all these four clusters show slow expansion speeds (typically ⟨vR⟩/σR ≲ 0.3 ± 0.1), suggesting they might be close to equilibrium.
Lim et al. (2020) studied the star-forming region W4, where the cluster IC 1805 is located. They found that the cluster is composed of an isotropic core and an external region showing clear evidence of expansion. These features suggest that the cluster is experiencing expansion after an early, initial collapsing phase (Lim et al. 2020). We also found a strong indication of expansion in IC 1805, although we did not find evidence for a central isotropic core in the cluster.
The cluster NGC 2244 lies at the center of the Rosette Nebula. The region shows a complex interplay between stellar and gas kinematics and feedback-driven star formation in sub-structured environments. Both rotation and expansion were found in NGC 2244 (Lim et al. 2021). In our study we also found NGC 2244 to be significantly expanding ( ).
).
Pang et al. (2021) investigated the connection between the cluster’s internal kinematics and their morphology. They found younger clusters to exhibit filament-like substructures while older ones show tidal-tail features. The majority of the systems are inferred gravitationally unbound and expanding (Pang et al. 2021). In the present study, mild expansion has been directly detected in NGC 2422, NGC 2451a, NGC 2451b, and NGC 2232. On the other hand, neither expansion nor contraction has been found in NGC 2516, which is suggested to be in a super virial state (Pang et al. 2021). Investigating internal kinematic patterns, or dependences on cluster morphology for each cluster is beyond the scope of this work. We defer this topic to a follow-up study.
In summary, the excellent agreement with previous, detailed studies that focused on a handful of systems suggests that our results are solid and that we are effectively probing the expansion of young stellar clusters.
7. Discussion and conclusion
We performed a comprehensive analysis of the internal kinematics of young star clusters (t < 300 Myr) in the Milky Way with the aim of reconstructing the key properties and possible physical mechanisms shaping the early cluster expansion. We emphasize that this analysis is based on a sample that is 20 times larger and spans a cluster age range 60 times larger than previous analyses (see, e.g., Kuhn et al. 2019), thus enabling for the first time the possibility of constraining the timescale during which expansion has a dominant impact on cluster kinematics and the fraction of stellar systems significantly affected by the expansion.
Our analysis reveals a clear trend in which the fraction of expanding clusters increases for younger clusters (see Table 2): a significant fraction of clusters younger than ∼30 Myr are characterized by a significant expansion, reaching values as large as ⟨vR⟩/σR = 1.5 − 2. On the contrary, older clusters (t > 30 Myr) are mostly consistent with what is expected for systems in equilibrium. While it would be tempting to interpret the ⟨vR⟩/σR distribution as a function of time as an evolutionary sequence, we stress here that it represents an instantaneous picture of the current properties of stellar clusters and not a time evolution pattern. The results presented in this work would not significantly change if different catalogs of cluster ages were adopted.
A general comparison of the evolution of ⟨vR⟩/σR in N-body simulations following the violent relaxation and early dynamics of star clusters reveals ⟨vR⟩/σR values that span those found in most of the observed clusters. More realistic simulations that include additional processes (such as gas expulsion and mass loss due to stellar evolution) and explore a broader range of initial conditions will be required to explain the most extreme cases of expanding systems (⟨vR⟩/σR > 1.5 − 2) sampled by our observational analysis and for a more detailed and quantitative comparison of the observed kinematic patterns and the timescales associated with the early evolution. Finally, we note that extremely young clusters (with ages of less than a few megayears) not included in our sample would be necessary to probe the kinematic patterns associated with the systems’ very early dynamics. The lack of these systems is likely a selection effect, as they are probably embedded clusters that are harder to observe with Gaia. In this respect, future data from infrared surveys would provide relevant insights into the embedded cluster population (see for example the VISIONS survey; Meingast et al. 2023) and allow us to build a more complete dynamical picture of the evolution of these systems.
Acknowledgments
We thank the anonymous referee for their insightful comments which improved the quality of the paper. The data underlying this article will be shared on reasonable request to the corresponding author. This work uses data from the European Space Agency (ESA) space mission Gaia. Gaia data are being processed by the Gaia Data Processing and Analysis Consortium (DPAC). Funding for the DPAC is provided by national institutions, in particular, the institutions participating in the Gaia Multi-Lateral Agreement (MLA). A.D.C. and E.D. acknowledge financial support from the project Light-on-Dark granted by MIUR through PRIN2017-2017K7REXT contract. E.D. acknowledges financial support from the Fulbright Visiting Scholar program 2023. A.D.C. and E.D. are also grateful for the warm hospitality of Indiana University where part of this work was performed. E.V. acknowledges support from the John and A-Lan Reynolds Faculty Research Fund.
References
- Adams, F. C. 2000, ApJ, 542, 964 [NASA ADS] [CrossRef] [Google Scholar]
- Allison, R. J., Goodwin, S. P., Parker, R. J., et al. 2009, ApJ, 700, L99 [Google Scholar]
- Almeida, A., Monteiro, H., & Dias, W. S. 2023, MNRAS, 525, 2315 [NASA ADS] [CrossRef] [Google Scholar]
- Armstrong, J. J., Wright, N. J., Jeffries, R. D., & Jackson, R. J. 2020, MNRAS, 494, 4794 [NASA ADS] [CrossRef] [Google Scholar]
- Armstrong, J. J., Wright, N. J., Jeffries, R. D., Jackson, R. J., & Cantat-Gaudin, T. 2022, MNRAS, 517, 5704 [NASA ADS] [CrossRef] [Google Scholar]
- Banerjee, S., & Kroupa, P. 2013, ApJ, 764, 29 [CrossRef] [Google Scholar]
- Banerjee, S., & Kroupa, P. 2014, ApJ, 787, 158 [NASA ADS] [CrossRef] [Google Scholar]
- Bastian, N., & Lardo, C. 2018, ARA&A, 56, 83 [Google Scholar]
- Baumgardt, H., & Kroupa, P. 2007, MNRAS, 380, 1589 [NASA ADS] [CrossRef] [Google Scholar]
- Beccari, G., Boffin, H. M. J., Jerabkova, T., et al. 2018, MNRAS, 481, L11 [Google Scholar]
- Bossini, D., Vallenari, A., Bragaglia, A., et al. 2019, A&A, 623, A108 [NASA ADS] [CrossRef] [EDP Sciences] [Google Scholar]
- Bravi, L., Zari, E., Sacco, G. G., et al. 2018, A&A, 615, A37 [NASA ADS] [CrossRef] [EDP Sciences] [Google Scholar]
- Brinkmann, N., Banerjee, S., Motwani, B., & Kroupa, P. 2017, A&A, 600, A49 [NASA ADS] [CrossRef] [EDP Sciences] [Google Scholar]
- Buckner, A. S. M., Khorrami, Z., González, M., et al. 2020, A&A, 636, A80 [NASA ADS] [CrossRef] [EDP Sciences] [Google Scholar]
- Cantat-Gaudin, T., & Anders, F. 2020, A&A, 633, A99 [NASA ADS] [CrossRef] [EDP Sciences] [Google Scholar]
- Cantat-Gaudin, T., Jordi, C., Wright, N. J., et al. 2019a, A&A, 626, A17 [NASA ADS] [CrossRef] [EDP Sciences] [Google Scholar]
- Cantat-Gaudin, T., Mapelli, M., Balaguer-Núñez, L., et al. 2019b, A&A, 621, A115 [NASA ADS] [CrossRef] [EDP Sciences] [Google Scholar]
- Cantat-Gaudin, T., Anders, F., Castro-Ginard, A., et al. 2020, A&A, 640, A1 [NASA ADS] [CrossRef] [EDP Sciences] [Google Scholar]
- Daffern-Powell, E. C., & Parker, R. J. 2020, MNRAS, 493, 4925 [Google Scholar]
- Dalessandro, E., Varri, A. L., Tiongco, M., et al. 2021, ApJ, 909, 90 [NASA ADS] [CrossRef] [Google Scholar]
- Damiani, F., Prisinzano, L., Pillitteri, I., Micela, G., & Sciortino, S. 2019, A&A, 623, A112 [NASA ADS] [CrossRef] [EDP Sciences] [Google Scholar]
- de La Fuente Marcos, R. 1997, A&A, 322, 764 [NASA ADS] [Google Scholar]
- Della Croce, A., Dalessandro, E., Livernois, A., et al. 2023, A&A, 674, A93 [NASA ADS] [CrossRef] [EDP Sciences] [Google Scholar]
- Dias, W. S., Monteiro, H., Moitinho, A., et al. 2021, MNRAS, 504, 356 [NASA ADS] [CrossRef] [Google Scholar]
- Dinnbier, F., & Kroupa, P. 2020, A&A, 640, A85 [EDP Sciences] [Google Scholar]
- Dinnbier, F., Kroupa, P., Šubr, L., & Jeřábková, T. 2022, ApJ, 925, 214 [NASA ADS] [CrossRef] [Google Scholar]
- Domínguez, R., Fellhauer, M., Blaña, M., Farias, J. P., & Dabringhausen, J. 2017, MNRAS, 472, 465 [CrossRef] [Google Scholar]
- Elmegreen, B. G. 1983, MNRAS, 203, 1011 [NASA ADS] [CrossRef] [Google Scholar]
- Farias, J. P., & Tan, J. C. 2023, MNRAS, 523, 2083 [NASA ADS] [CrossRef] [Google Scholar]
- Farias, J. P., Tan, J. C., & Chatterjee, S. 2017, ApJ, 838, 116 [NASA ADS] [CrossRef] [Google Scholar]
- Feigelson, E. D., Townsley, L. K., Broos, P. S., et al. 2013, ApJS, 209, 26 [Google Scholar]
- Foreman-Mackey, D., Hogg, D. W., Lang, D., & Goodman, J. 2013, PASP, 125, 306 [Google Scholar]
- Fujii, M. S., & Portegies Zwart, S. 2016, ApJ, 817, 4 [NASA ADS] [CrossRef] [Google Scholar]
- Gaia Collaboration (Vallenari, A., et al.) 2023, A&A, 674, A1 [NASA ADS] [CrossRef] [EDP Sciences] [Google Scholar]
- Getman, K. V., Feigelson, E. D., Kuhn, M. A., et al. 2018, MNRAS, 476, 1213 [NASA ADS] [CrossRef] [Google Scholar]
- González-Samaniego, A., & Vazquez-Semadeni, E. 2020, MNRAS, 499, 668 [CrossRef] [Google Scholar]
- Goodwin, S. P., & Bastian, N. 2006, MNRAS, 373, 752 [Google Scholar]
- Gratton, R., Bragaglia, A., Carretta, E., et al. 2019, A&ARv, 27, 8 [Google Scholar]
- Guilherme-Garcia, P., Krone-Martins, A., & Moitinho, A. 2023, A&A, 673, A128 [NASA ADS] [CrossRef] [EDP Sciences] [Google Scholar]
- Hills, J. G. 1980, ApJ, 235, 986 [NASA ADS] [CrossRef] [Google Scholar]
- Hunt, E. L., & Reffert, S. 2023, A&A, 673, A114 [NASA ADS] [CrossRef] [EDP Sciences] [Google Scholar]
- Hurley, J. R., Pols, O. R., Aarseth, S. J., & Tout, C. A. 2005, MNRAS, 363, 293 [NASA ADS] [CrossRef] [Google Scholar]
- Kharchenko, N. V., Piskunov, A. E., Schilbach, E., Röser, S., & Scholz, R. D. 2013, A&A, 558, A53 [NASA ADS] [CrossRef] [EDP Sciences] [Google Scholar]
- Kroupa, P. 2001, MNRAS, 322, 231 [NASA ADS] [CrossRef] [Google Scholar]
- Kroupa, P., Aarseth, S., & Hurley, J. 2001, MNRAS, 321, 699 [NASA ADS] [CrossRef] [Google Scholar]
- Kuhn, M. A., Hillenbrand, L. A., Sills, A., Feigelson, E. D., & Getman, K. V. 2019, ApJ, 870, 32 [CrossRef] [Google Scholar]
- Kuhn, M. A., Hillenbrand, L. A., Carpenter, J. M., & Avelar Menendez, A. R. 2020, ApJ, 899, 128 [NASA ADS] [CrossRef] [Google Scholar]
- Lada, C. J., & Lada, E. A. 2003, ARA&A, 41, 57 [Google Scholar]
- Leveque, A., Giersz, M., Banerjee, S., et al. 2022, MNRAS, 514, 5739 [NASA ADS] [CrossRef] [Google Scholar]
- Li, H., Vogelsberger, M., Marinacci, F., & Gnedin, O. Y. 2019, MNRAS, 487, 364 [NASA ADS] [CrossRef] [Google Scholar]
- Lim, B., Hong, J., Yun, H.-S., et al. 2020, ApJ, 899, 121 [CrossRef] [Google Scholar]
- Lim, B., Nazé, Y., Hong, J., et al. 2021, AJ, 162, 56 [NASA ADS] [CrossRef] [Google Scholar]
- Lim, B., Nazé, Y., Hong, J., et al. 2022, AJ, 163, 266 [NASA ADS] [CrossRef] [Google Scholar]
- Lindegren, L., Klioner, S. A., Hernández, J., et al. 2021, A&A, 649, A2 [EDP Sciences] [Google Scholar]
- Livernois, A., Vesperini, E., Tiongco, M., Varri, A. L., & Dalessandro, E. 2021, MNRAS, 506, 5781 [NASA ADS] [CrossRef] [Google Scholar]
- Maíz Apellániz, J., Pantaleoni González, M., Barbá, R. H., & Weiler, M. 2022, A&A, 657, A72 [NASA ADS] [CrossRef] [EDP Sciences] [Google Scholar]
- Mapelli, M. 2017, MNRAS, 467, 3255 [NASA ADS] [CrossRef] [Google Scholar]
- Mathieu, R. D. 1983, ApJ, 267, L97 [NASA ADS] [CrossRef] [Google Scholar]
- McInnes, L., & Healy, J. 2017, 2017 IEEE International Conference on Data Mining Workshops (ICDMW) (IEEE), 33 [CrossRef] [Google Scholar]
- McInnes, L., Healy, J., & Astels, S. 2017, J. Open Source Softw., 2, 205 [NASA ADS] [CrossRef] [Google Scholar]
- McMillan, S. L. W., Vesperini, E., & Portegies Zwart, S. F. 2007, ApJ, 655, L45 [Google Scholar]
- Meingast, S., & Alves, J. 2019, A&A, 621, L3 [NASA ADS] [CrossRef] [EDP Sciences] [Google Scholar]
- Meingast, S., Alves, J., Bouy, H., et al. 2023, A&A, 673, A58 [NASA ADS] [CrossRef] [EDP Sciences] [Google Scholar]
- Milone, A. P., & Marino, A. F. 2022, Universe, 8, 359 [NASA ADS] [CrossRef] [Google Scholar]
- Miret-Roig, N., Galli, P. A. B., Olivares, J., et al. 2022, A&A, 667, A163 [NASA ADS] [CrossRef] [EDP Sciences] [Google Scholar]
- Moeckel, N., & Bonnell, I. A. 2009, MNRAS, 396, 1864 [NASA ADS] [CrossRef] [Google Scholar]
- Offner, S. S. R., Hansen, C. E., & Krumholz, M. R. 2009, ApJ, 704, L124 [NASA ADS] [CrossRef] [Google Scholar]
- Pang, X., Li, Y., Yu, Z., et al. 2021, ApJ, 912, 162 [NASA ADS] [CrossRef] [Google Scholar]
- Parker, R. J., Wright, N. J., Goodwin, S. P., & Meyer, M. R. 2014, MNRAS, 438, 620 [Google Scholar]
- Parker, R. J., Goodwin, S. P., Wright, N. J., Meyer, M. R., & Quanz, S. P. 2016, MNRAS, 459, L119 [NASA ADS] [CrossRef] [Google Scholar]
- Pelupessy, F. I., & Portegies Zwart, S. 2012, MNRAS, 420, 1503 [NASA ADS] [CrossRef] [Google Scholar]
- Pfalzner, S., & Kaczmarek, T. 2013, A&A, 559, A38 [NASA ADS] [CrossRef] [EDP Sciences] [Google Scholar]
- Pfalzner, S., Parmentier, G., Steinhausen, M., Vincke, K., & Menten, K. 2014, ApJ, 794, 147 [NASA ADS] [CrossRef] [Google Scholar]
- Pryor, C., & Meylan, G. 1993, in Structure and Dynamics of Globular Clusters, eds. S. G. Djorgovski, & G. Meylan, ASP Conf. Ser., 50, 357 [Google Scholar]
- Román-Zúñiga, C. G., Roman-Lopes, A., Tapia, M., Hernández, J., & Ramírez-Preciado, V. 2019, ApJ, 871, L12 [CrossRef] [Google Scholar]
- Schoettler, C., de Bruijne, J., Vaher, E., & Parker, R. J. 2020, MNRAS, 495, 3104 [NASA ADS] [CrossRef] [Google Scholar]
- Schoettler, C., Parker, R. J., & de Bruijne, J. 2022, MNRAS, 510, 3178 [NASA ADS] [CrossRef] [Google Scholar]
- Sills, A., Rieder, S., Scora, J., McCloskey, J., & Jaffa, S. 2018, MNRAS, 477, 1903 [Google Scholar]
- Swiggum, C., D’Onghia, E., Alves, J., et al. 2021, ApJ, 917, 21 [NASA ADS] [CrossRef] [Google Scholar]
- Tarricq, Y., Soubiran, C., Casamiquela, L., et al. 2021, A&A, 647, A19 [NASA ADS] [CrossRef] [EDP Sciences] [Google Scholar]
- van Leeuwen, F. 2009, A&A, 497, 209 [CrossRef] [EDP Sciences] [Google Scholar]
- Vesperini, E., Varri, A. L., McMillan, S. L. W., & Zepf, S. E. 2014, MNRAS, 443, L79 [NASA ADS] [CrossRef] [Google Scholar]
- Wright, N. J., Jeffries, R. D., Jackson, R. J., et al. 2019, MNRAS, 486, 2477 [CrossRef] [Google Scholar]
All Tables
All Figures
|
Fig. 1. Astrometric and photometric properties of ASCC 113 members (shown in blue). In gray we show the properties of the initial sample of Gaia sources (see Sect. 2.1). The left panel shows the distributions in Galactic coordinates and parallax (top-right corner), the middle panel the proper motion (PM) distribution, and the right panel the CMD. The parallax distributions were scaled for visualization purposes only. |
| In the text | |
|
Fig. 2. Comparison of member stars between this work and Cantat-Gaudin et al. (2020, NGC + 20) for all the clusters included in the analysis. Diagonal lines show the one-to-one relation and the relations corresponding to half and twice the members (as also reported in the plot). |
| In the text | |
|
Fig. 3. Age distributions for clusters in the starting catalog (in red, Cantat-Gaudin et al. 2020) and those retained in the kinematic analysis (in blue). Histograms were normalized such that their areas sum to unity. |
| In the text | |
|
Fig. 4. Ratio between the mean radial velocity and the radial velocity dispersion for clusters younger than 300 Myr (according to Cantat-Gaudin et al. 2020). Errors on the y-axes were obtained directly from the MCMC samples, and ages are from Cantat-Gaudin et al. (2020). In the left panel, clusters are color-coded according to the number of members. The standard deviation (and twice the value) of the ⟨vR⟩/σR ratio obtained from numerical realizations of equilibrium star clusters (see Sect. 4.2) are shown as gray-shaded areas. Values obtained from numerical realizations were convolved with the median observational error to allow for a direct comparison with the underlying data. In the middle panel, colors depict R50, whereas in the right panel, the color coding represents the ratio between the slope and the corresponding error from the linear regression of radial velocities as a function of cluster-centric distance. |
| In the text | |
|
Fig. 5. Kinematic properties of NGC 6139, NGC 4103, LP 2219, and NGC 3114 (from top to bottom). The left panels show the spatial distribution of members in Cartesian coordinates normalized to the radius enclosing half of the members, with arrows showing the velocity vectors on the plane of the sky. The arrow lengths are proportional to the speed on the plane of the sky (velocity scale reported in the top-right corners), while their colors map the radial component (vR) of the velocity. Positive values point outward. The right panels show the distribution of members in the vR − R plane. The linear regressions of velocities as a function of the cluster-centric distances are shown (orange lines), as are the posterior values on the slopes (at the bottom). |
| In the text | |
|
Fig. 6. Distribution of ⟨vR⟩/σR as a function of the age for the 227 clusters in common with Almeida et al. (2023). The color coding depicts the cluster mass, Mcl. |
| In the text | |
|
Fig. 7. Time evolution of the ratio between the mean radial velocity and the radial velocity dispersions for a selection of models from Livernois et al. (2021) for all stars within the tidal radius. |
| In the text | |
|
Fig. 8. Mean radial velocity to radial velocity dispersion ratio as a function of cluster age for different age estimates (from left to right): Kharchenko et al. (2013), Bossini et al. (2019), Dias et al. (2021), and Hunt & Reffert (2023). Errors on the y-axis are obtained from the MCMC sampling of the posterior, while those on the x-axis (if present) are age errors provided by the different catalogs. The zero-level expansion is marked by the dark dashed line. |
| In the text | |
Current usage metrics show cumulative count of Article Views (full-text article views including HTML views, PDF and ePub downloads, according to the available data) and Abstracts Views on Vision4Press platform.
Data correspond to usage on the plateform after 2015. The current usage metrics is available 48-96 hours after online publication and is updated daily on week days.
Initial download of the metrics may take a while.