Fig. 4.
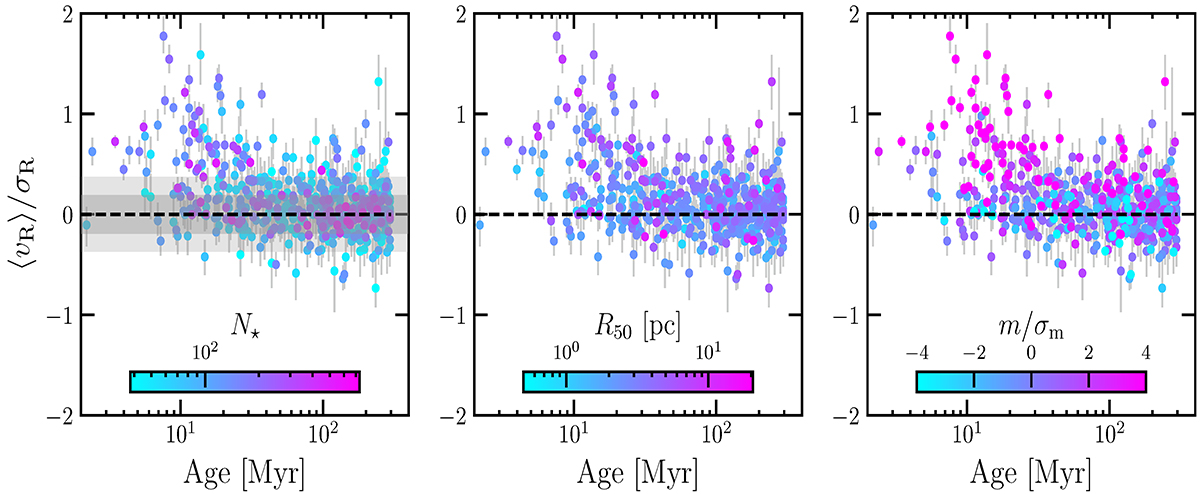
Download original image
Ratio between the mean radial velocity and the radial velocity dispersion for clusters younger than 300 Myr (according to Cantat-Gaudin et al. 2020). Errors on the y-axes were obtained directly from the MCMC samples, and ages are from Cantat-Gaudin et al. (2020). In the left panel, clusters are color-coded according to the number of members. The standard deviation (and twice the value) of the ⟨vR⟩/σR ratio obtained from numerical realizations of equilibrium star clusters (see Sect. 4.2) are shown as gray-shaded areas. Values obtained from numerical realizations were convolved with the median observational error to allow for a direct comparison with the underlying data. In the middle panel, colors depict R50, whereas in the right panel, the color coding represents the ratio between the slope and the corresponding error from the linear regression of radial velocities as a function of cluster-centric distance.
Current usage metrics show cumulative count of Article Views (full-text article views including HTML views, PDF and ePub downloads, according to the available data) and Abstracts Views on Vision4Press platform.
Data correspond to usage on the plateform after 2015. The current usage metrics is available 48-96 hours after online publication and is updated daily on week days.
Initial download of the metrics may take a while.