Fig. 6
Download original image
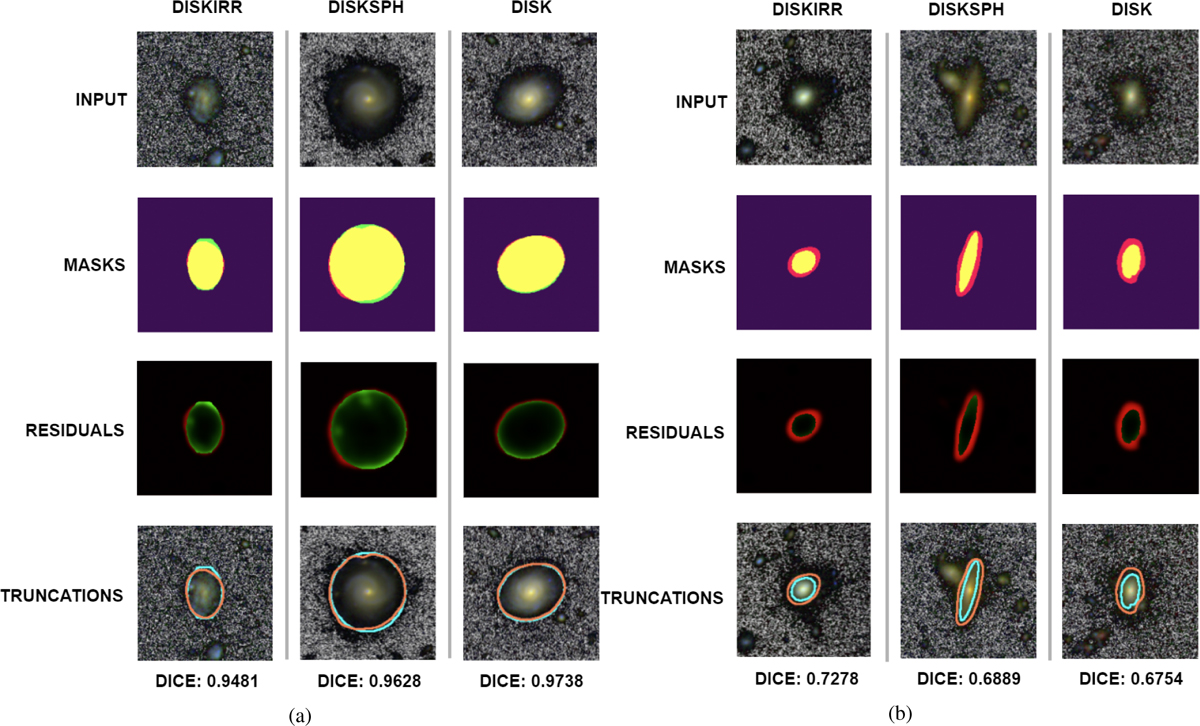
Greatest (a) and least (b) accurate inferences by morphology for the best-performing model on the test dataset. First row shows the images of the galaxies. Second row displays the overlap of the predicted and real masks, where yellow, red and green zones represent true positives, false positives, and false negatives, respectively. The third row shows the residuals, where reddish and greenish tones represent negative and positive residuals, and the value (from light to dark) indicates their magnitude (from higher to lower). The last row shows the predicted and real truncations superimposed on the images.
Current usage metrics show cumulative count of Article Views (full-text article views including HTML views, PDF and ePub downloads, according to the available data) and Abstracts Views on Vision4Press platform.
Data correspond to usage on the plateform after 2015. The current usage metrics is available 48-96 hours after online publication and is updated daily on week days.
Initial download of the metrics may take a while.