Fig. 4
Download original image
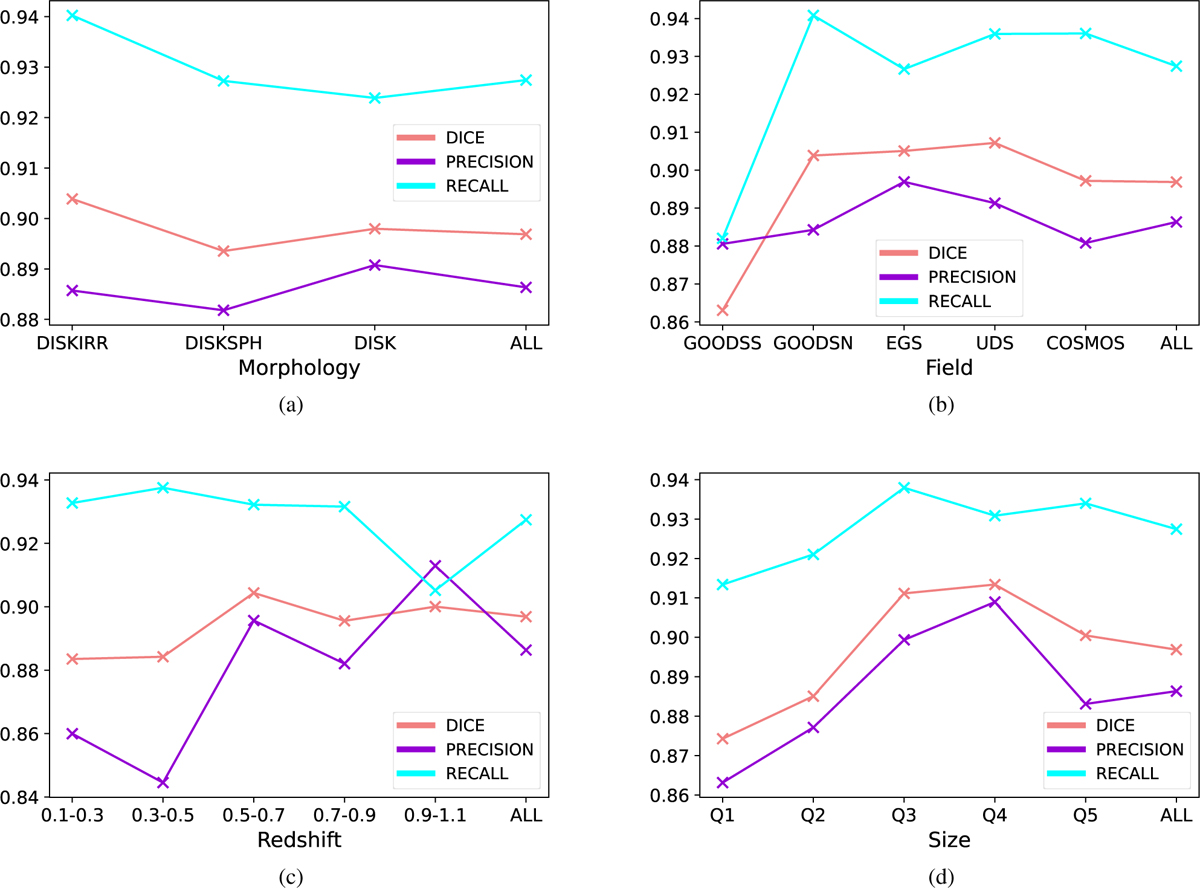
Metrics over the test set by galaxy morphology (a), field of view (b), redshift (c), and size (d) for our best performing model. The first plot a shows mean dice, precision, and recall for DISKIRR, DISKSPH, DISK, and all morphologies. The second plot b displays the same metrics for all our galaxy fields, namely EGS, GOODSN, COSMOS, UDS, and GOODSS. The third and fourth plots shows the same metrics for the five redshift bins and the five size quintiles the galaxy sample is split into.
Current usage metrics show cumulative count of Article Views (full-text article views including HTML views, PDF and ePub downloads, according to the available data) and Abstracts Views on Vision4Press platform.
Data correspond to usage on the plateform after 2015. The current usage metrics is available 48-96 hours after online publication and is updated daily on week days.
Initial download of the metrics may take a while.