Open Access
Fig. 10
Download original image
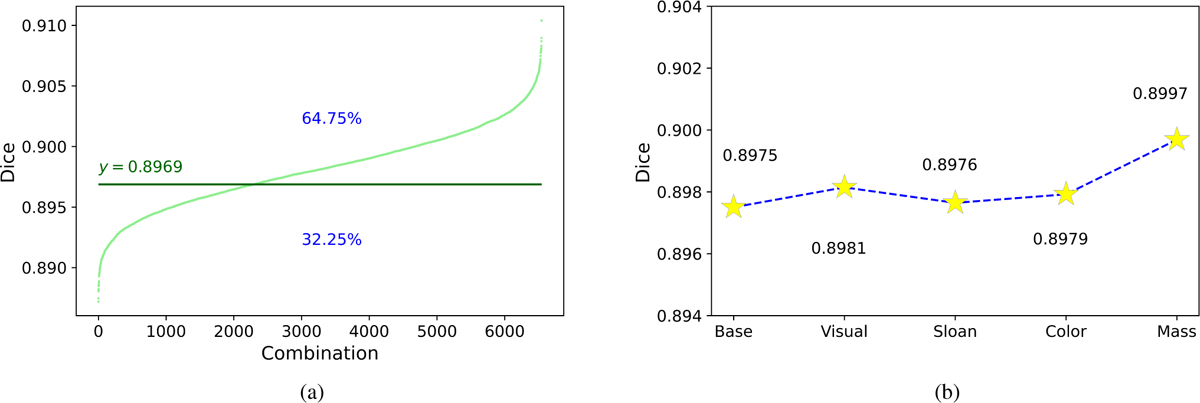
Metrics summarizing the behavior of the ensembles. The left plot a shows the sorted dice index values for all built ensembles. The right plot b displays, for each AA, the average dice index of all assemblies in which that AA participates at least one time.
Current usage metrics show cumulative count of Article Views (full-text article views including HTML views, PDF and ePub downloads, according to the available data) and Abstracts Views on Vision4Press platform.
Data correspond to usage on the plateform after 2015. The current usage metrics is available 48-96 hours after online publication and is updated daily on week days.
Initial download of the metrics may take a while.