| Issue |
A&A
Volume 682, February 2024
|
|
|---|---|---|
| Article Number | L1 | |
| Number of page(s) | 7 | |
| Section | Letters to the Editor | |
| DOI | https://doi.org/10.1051/0004-6361/202348754 | |
| Published online | 26 January 2024 | |
Letter to the Editor
Evidence for inflows and outflows in the nearby black hole transient Swift J1727.8−162
1
Instituto de Astrofísica de Canarias, 38205 La Laguna, Tenerife, Spain
e-mail: This email address is being protected from spambots. You need JavaScript enabled to view it.
, This email address is being protected from spambots. You need JavaScript enabled to view it.
2
Departamento de Astrofísica, Univ. de La Laguna, 38206 La Laguna, Tenerife, Spain
Received:
27
November
2023
Accepted:
8
January
2024
Abstract
We present 20 epochs of optical spectroscopy obtained with the GTC-10.4m telescope across the bright discovery outburst of the black hole candidate Swift J1727.8−162. The spectra cover the main accretion states and are characterised by the presence of hydrogen and helium emission lines, commonly observed in these objects. They show complex profiles, including double peaks, but also blue-shifted absorptions (with blue-edge velocities of 1150 km s−1), broad emission wings, and flat-top profiles, which are the usual signatures of accretion disc winds. Moreover, red-shifted absorptions accompanied by blue emission excesses suggest the presence of inflows in at least two epochs, although a disc origin cannot be ruled out. Using pre-outburst imaging from Pan-STARRS, we identify a candidate quiescent optical counterpart with a magnitude of g ∼ 20.8. This implies an outburst optical amplitude of ΔV ∼ 7.7, supporting an estimated orbital period of ∼7.6 h, which favours an early K-type companion star. Employing various empirical methods, we derive a distance to the source of d = 2.7 ± 0.3 kpc, corresponding to a Galactic plane elevation of z = 0.48 ± 0.05 kpc. Based on these findings, we propose that Swift J1727.8−162 is a nearby black hole X-ray transient that exhibited complex signatures of optical inflows and outflows throughout its discovery outburst.
Key words: accretion / accretion disks / stars: black holes / stars: individual: Swift J1727.8-162 / X-rays: binaries
© The Authors 2024
 Open Access article, published by EDP Sciences, under the terms of the Creative Commons Attribution License (https://creativecommons.org/licenses/by/4.0), which permits unrestricted use, distribution, and reproduction in any medium, provided the original work is properly cited.
This article is published in open access under the Subscribe to Open model. This email address is being protected from spambots. You need JavaScript enabled to view it. to support open access publication.
1. Introduction
Swift J1727.8−162 (hereafter J1727) was originally identified as a gamma-ray burst (GRB 230824A; Lipunov et al. 2023; Page et al. 2023) by Swift on August 24, 2023 (MJD 60180.5831; all times will be referred to this date). The duration and X-ray colour of the event, however, led to a new improved classification as a low-mass X-ray binary, whose outburst evolution was immediately followed by the MAXI/GSC (Negoro et al. 2023; Nakajima et al. 2023) and NICER (O’Connor et al. 2023) observatories. The source evolved through the X-ray hard and soft states (see e.g. Bollemeijer et al. 2023a; Miller-Jones et al. 2023a), following the canonical behaviour for black hole transients (BHTs; e.g. Done et al. 2007; Belloni et al. 2011). The brightness of the event (see e.g. Palmer & Parsotan 2023) prompted multiwavelength campaigns with ground-based monitoring. Optical follow-up revealed a very bright r ∼ 12.7 counterpart (Wang & Bellm 2023; Baglio et al. 2023; Alabarta et al. 2023), which subsequently started a slow decline over the outburst duration. This enabled spectroscopy from the early stages of the outburst (Castro-Tirado et al. 2023), revealing typical Doppler-broadened emission lines of H and He species. Mata Sanchez & Muñoz-Darias (2023) further extended the identification to other metallic transitions while reporting on the detection of blue-shifted absorption features in a number of lines, a hallmark of cold disc outflows.
In this Letter we confirm the detection of outflows through the analysis of multi-epoch optical spectroscopy obtained during the first 62 days of the outburst and across all the classical accretion states. Additionally, we present a pre-outburst optical counterpart and provide constraints on some fundamental parameters, such as the orbital period and the distance to the source.
2. Observations
We obtained 20 spectroscopic epochs with the 10.4m Gran Telescopio Canarias (GTC) at the Roque de los Muchachos Observatory (La Palma, Spain), equipped with the Optical System for Imaging and low-Intermediate-Resolution Integrated Spectroscopy (OSIRIS, Cepa et al. 2000). The observing set-up varied across the different epochs, as detailed in Table 1. The spectra were reduced, extracted, and wavelength-calibrated in PYRAF and MOLLY. We employed sky emission lines to correct from flexure effects on the wavelength calibration, finding sub-pixel drifts.
Journal of observations.
3. Analysis and results
3.1. Hardness–intensity diagram
In order to put our observations in context with the outburst evolution, we built a hardness–intensity diagram (HID, Homan et al. 2001) employing daily averaged fluxes from MAXI (see Fig. 1). The HID follows the canonical q-shaped hysteresis pattern observed in BHTs (e.g. Fender & Belloni 2012), characterised by lower hardness values than their neutron star counterparts (e.g. Muñoz-Darias et al. 2014). The X-ray state of each GTC epoch is listed in Table 1. Inspection of the HID reveals that there were X-ray detections prior to the outburst trigger. During the initial outburst rise in the hard state, quasi-periodic oscillations (QPOs) were detected evolving from 0.4 Hz to 1.4 Hz (Palmer & Parsotan 2023; Draghis et al. 2023; Katoch et al. 2023a,b; Debnath et al. 2023). The source entered the hard-intermediate state (HIMS) in day 9, as QPOs developed at higher frequencies (4 − 6 Hz, Bollemeijer et al. 2023a; Mereminskiy et al. 2023). Transition to the soft-intermediate state (SIMS) occurred a month later, based on the disappearance of the QPO and a drop in the aperiodic X-ray variability (Bollemeijer et al. 2023b; Belloni et al. 2005). On day 52 a transition to the soft state was reported (Trushkin et al. 2023), where the system gradually decayed in luminosity. At the time of writing this Letter, the outburst is still ongoing.
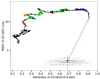 |
Fig. 1. HID constructed from MAXI data. Hardness corresponds to the ratio of the count rates in the 4–10 keV to the 2–4 keV bands, while the intensity corresponds to the count rate in the 2–20 keV band. The black line depicts the outburst evolution with the grey square representing a binning of ∼50 days of data prior to the X-ray trigger (shown as transparent points in the background). The stars mark the timestamps of our optical observations, coloured according to the X-ray state (see Table 1): hard state (blue), HIMS (green), SIMS (orange), and soft state (red). |
3.2. Evolution of the optical spectra
Five different epochs, representative of the collected data during the four different X-ray states, are shown in Fig. 2. The spectrum of J1727 is characterised by the presence of emission lines corresponding to H Balmer and Paschen series, He I (e.g. 5875.618 Å, 6678.149 Å) and He II (4685.750 Å, 5411.551 Å) transitions. The Bowen blend and emission from the Fe II forest (∼ 5284 Å) are also detected. We searched for short-term variability in our extended E2 observations (a total of 18 spectra), but could not see evidence of any within timescales of a few minutes to an hour. While this does not preclude stronger variability from occurring at a different state of the outburst, we base our study on the average spectral properties obtained for each epoch.
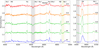 |
Fig. 2. Normalised spectrum of five relevant spectroscopic epochs. They are offset vertically by 0.25 (0.3 in the right panel) for visualisation purposes; the colours correspond to their X-ray state, as defined in Fig. 1. The identified transitions in this wavelength range are marked with dotted lines: black for H, red for He I, blue for He II, and green for other metallic lines (Bowen blend at ∼ 4640 Å). Telluric bands and interstellar features are shown as grey and yellow shadowed regions, respectively. The E20 spectrum was smoothed through convolution with a Gaussian for visualisation purposes. |
An overall view of the evolution of the emission lines reveals predominantly single-peaked lines during the bright hard state (E1 to E3), while at later epochs (HIMS) they develop a double-peaked structure, first on the He I and He II transitions, (starting on E4) and later over the H series (e.g. E16). We performed single and two-Gaussian fits to each Hα, Hγ, and Hδ line, as the remaining transitions are too weak (even undetectable at certain epochs, see e.g. He I-6678 Å) or contaminated by nearby features (e.g. He I-5876 Å, Hβ). In spite of the presence of variable asymmetric components distorting the profiles (described below), the single-Gaussian fit yields an average full width at half maximum of FWHM = 750 ± 120 km s−1. The two-Gaussian fit leads to a consistent centroid velocity across all epochs of −170 ± 50 km s−1. Given the multi-epoch stability of the line centroid, we adopt it as the tentative radial systemic velocity of J1727. We refer any line profile to this value (i.e. in the binary rest frame). We note that a Gaussian fit to He II-4686 Å yields a consistent centroid, although the FWHM increases monotonically as the outburst progresses, reaching FWHM = 1500 ± 300 km s−1 in the soft state observation (E20, see Fig. 2).
Hα and He I-5876 Å are usually the best lines to search for outflows. In the case of J1727, the presence of nearby and strong telluric features hampers a clean detection. Hβ is similarly affected by the presence of a diffuse interstellar band (DIB) that contaminates the red wing of the line. For this reason we initially focus our analysis on Hγ and Hδ. We find two remarkable patterns on the profiles (see Figs. 2 and 3 for examples of the epochs cited below):
-
Blue-shifted absorptions: They consistently appear in the Balmer series across most epochs. He I transitions do not show such clear patterns, but He II-4686 Å does, dipping below the continuum (see e.g. E11). The absorption depth is variable, being at its deepest in E8 and E11, reaching 7% below the continuum level for Hβ (4% for Hγ). They show blue-edge velocities of ∼ − 1150 km s−1, which remain consistent across all epochs.
-
Red-shifted absorptions: A number of epochs exhibit red-shifted absorptions (E4, E7, E9, E10, E19). They meet the continuum at ∼900 km s−1, a velocity ∼20% lower than that of their blue-shifted counterparts, and exhibit slightly shallower depths. The deepest absorption is found in epoch E10 (a day before the deepest blue-shifted absorption was observed) being 2% below the continuum level for Hγ. These red-shifted absorptions can be accompanied by blue-shifted absorptions (E10), broad blue wings (E4, E7), skewed (E9, E10), or even flat-top (E7) emission line profiles. We note that even the high excitation He II-4686 Å line exhibited these red-shifted absorptions in E4 and E7.
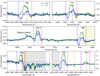 |
Fig. 3. Normalised spectrum of epochs E7 (green) and E11 (blue). They are representatives of the blue-shifted and red-shifted absorption features detected during the outburst. The identified transitions in this wavelength range are marked with black dashed lines (in the laboratory rest frame), while the velocities of ±900 km s−1 and ±1150 km s−1 (referred to the rest wavelength of each line after accounting for the systemic velocity) are marked with red and blue dashed lines, respectively. Telluric bands and interstellar features are shown as grey and yellow shadowed regions, respectively. |
4. Discussion
4.1. Optical accretion disc winds
We detect blue-shifted absorptions (E11, Fig. 3) sometimes accompanied by a red tail excess (E3, Fig. 2), matching the prescription for P Cygni profiles (e.g. Muñoz-Darias et al. 2016; Sánchez-Sierras et al. 2023). They persist across the outburst, predominantly in the H Balmer series, with stable terminal velocities (∼ − 1150 km s−1) consistent with previous studies in other BHTs (see Panizo-Espinar et al. 2022). In addition, these systems can also show broad emission wings that meet the continuum at the same velocity as the P Cygni profiles. These features are thought to be associated with optically thin ejecta, as well as ultimately responsible for the so-called nebular phase (e.g. Mata Sánchez et al. 2018). Flat top (E7, see Fig. 3) and skewed (E9, E10, see Fig. 2) profiles, both typically associated with the presence of outflows, are also identified. All this phenomenology (see Table A.1 for a compilation) suggests the continuous presence of outflows signatures during the hard state, HIMS, and SIMS, as shown by other BHTs in outburst (e.g. Muñoz-Darias et al. 2019; Panizo-Espinar et al. 2022).
The analysis of the J1727 spectra is complex due to the presence of contaminants and the multi-component nature of the line profiles. While the effect of DIBs and telluric absorptions can be mitigated by analysing clean wavelength regions, the detection of red-shifted absorptions at certain epochs poses a challenge. We propose two alternative scenarios to explain them. On the one hand, the simultaneous presence of a weaker blue-shifted absorption component during epochs with red-shifted absorptions (e.g. Balmer series in E10) suggests that the emission line might be embedded into a broad absorption component. These have been observed in H and He I transitions in other BHTs (e.g. GRO J1655−40; Soria et al. 2000). Their origin is still debated, as predictions from the most commonly accepted model (Dubus et al. 2001) have been challenged (see e.g. Mata Sánchez et al. 2022 and references therein). On the other hand, narrow red-shifted absorptions have been previously reported in the optical spectra of the BHT GRS 1716−249 (Cúneo et al. 2020), and described as inverse P Cygni profiles (i.e. inflow signatures). In our dataset, the line profiles of Hγ and Hδ in E4 and E7 (see Fig. 3) are the most promising candidates supporting this scenario, as they are concurrent with extended blue emission wings. To shed some light on this matter, we searched for outflows and broad absorption features with the machine learning classifier ATM (Mata Sánchez et al. 2023) adapted to the Hγ and Hδ lines (which are free from nearby contaminants). The resulting classifications (collected in Table A.1) support the detection of outflow features (mainly as blue-shifted absorptions) in several epochs, while a number of profiles are classified as embedded in a broad absorption component (including some with narrow red-shifted absorption features; e.g. E7, E19). A Monte Carlo approach reveals, for spectra where the classifier struggles the most, that the broad absorption class is the second most likely classification (typically ∼30 − 40% association probability). This suggests that a broad absorption component might be present during most of the outburst, but only dominates the profile at certain epochs. The absence of a dedicated inflow class in ATM precludes further inspection.
Another puzzling result is the detection of possible outflow features in He II-4686 Å, including blue-shifted absorptions dipping below the continuum (E11, Fig. 3) and skewed profiles (E3, see Fig. 2). This line behaves as the rest of the simultaneously observed transitions in these epochs, both in terms of depth and blue-edge velocity, which leads us to conclude that it traces the same phenomena. This would be one of the few detections of outflows in a high-ionisation optical transition, with Swift J1357.2−0933 being the only precedent (Charles et al. 2019; Jiménez-Ibarra et al. 2019).
The only observation in our sample during the soft state is E20 (Fig. 2). By then, Hγ exhibits a skewed profile (where the blue peak is absorbed, compared to other symmetric double-peaked transitions). There is a blue-shifted absorption in Hβ reaching 4% below the continuum (comparable to E16, see Fig. 2). However, the contaminants in the red wing of Hβ, as well as the lack of a similar feature in other lines, preclude a definitive confirmation. An unambiguous detection of optical outflows during the soft state of a BHT remains elusive (but see Ponti et al. 2012; Sánchez-Sierras & Muñoz-Darias 2020; Muñoz-Darias & Ponti 2022; Parra et al. 2024 for wind detections at infrared and X-ray wavelengths).
4.2. Quiescent counterpart and orbital period
Using the radio coordinates [RA (J2000) 17:27:43.31 ± 0.04 s, Dec (J2000): −16:12:19.23 ± 0.02″] given by Miller-Jones et al. (2023b), we searched for the quiescent counterpart in all-sky public photometric catalogues. We found a single candidate in both Pan-STARRS DR1 (PS1, Chambers et al. 2016; ID 88552619307433951) and in Gaia DR3 (Gaia Collaboration 2016, 2023; ID 4136619720186379264). The Gaia and radio positions, after correcting for the proper motion, are consistent within 2.5σ (∼0.07″; see Fig. 4). We consider this matching object the quiescent counterpart. In the calculations that follow we use the mean PS1 PSF magnitudes: g = 20.82 ± 0.05, r = 19.95 ± 0.04, i = 19.41 ± 0.02, z = 19.06 ± 0.02.
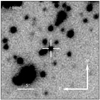 |
Fig. 4. Pre-outburst quiescent counterpart of J1727 from PS1 r-band images. The position of the quiescent counterpart is marked with a white cross. |
Determination of the orbital period during the outburst usually relies on either the detection of eclipses, dips (both limited to high-inclination orbits), or photometric modulations. Neither have been reported so far for J1727. We use the correlation in Shahbaz & Kuulkers (1998) connecting this binary parameter with the V-band outburst amplitude:

To calculate ΔV we take the outburst peak V-band magnitude Voutburst = 12.66 ± 0.01 (Alabarta et al. 2023), measured on day 4.8 (simultaneous to the peak at X-rays). We established a quiescent V-band magnitude of Vquiescence = 20.31 ± 0.06 applying photometric system transformations (Jordi et al. 2006; Tonry et al. 2012) to the PS1 pre-outburst photometry. This leads to ΔV = 7.65 ± 0.06 and Porb = 7.57 ± 0.14 h. Following Faulkner et al. (1972), the combination of such Porb with the assumption of a Roche-Lobe filling dwarf companion star (with mean density as per Drilling & Landolt 2000) imply an early K spectral type. This result should be taken with some caution as different systematics might be at play (see e.g. López et al. 2019).
4.3. The distance to J1727
No radio parallax is known to date for J1727, while the parallax from Gaia DR3 (π = 0.03 ± 0.39 m.a.s.) results in an unconstraining posterior distribution (see e.g. XTE J1118+480 in Gandhi et al. 2019). We thus here employ different methods to constrain its distance and reddening.
Casares (2018) presents an empirical correlation between the absolute r-band magnitude for BHTs in quiescence and Porb:

Adopting Porb = 7.57 ± 0.14 h we obtain Mr = 6.50 ± 0.13. Mr can be used in combination with the pre-outburst r-band magnitude (r = 19.95 ± 0.04) and Ar extinction to calculate the distance. Ar can be derived from the reddening to the source E(B − V), using Ar/AV = 2.271 (Schlafly & Finkbeiner 2011) and AV = 3.1 E(B − V) (Savage & Mathis 1979; Fitzpatrick 2004). We apply several methods to constrain the colour excess E(B − V) and/or distance:
-
The equivalent width (EW) of the interstellar line K I 7699 is a known tracer of the reddening (Munari & Zwitter 1997), and covered during E5. Nearby telluric features limited the precision of its measurement as they affected the determination of the adjacent continuum. We employed a Monte Carlo approach to simulate 105 spectra using as a seed the original data and its observational uncertainties, and obtained EW = 0.21 ± 0.07 Å, implying E(B − V) = 0.9 ± 0.3, which results in d = 2.0 ± 0.7 kpc.
-
The DIB at 8621 Å is also correlated with reddening (Wallerstein et al. 2007). Its equivalent width of EW = 0.18 ± 0.06 Å, measured with the same method as above, corresponds to E(B − V) = 0.8 ± 0.3 and to a distance of d = 2.2 ± 0.7 kpc.
-
The hydrogen column density was estimated from X-ray fitting to be in the range of NH = (2.26 − 4.1) × 1021 cm−2 (O’Connor et al. 2023; Draghis et al. 2023), with a mean value of NH = (3.2 ± 0.9) × 1021 cm−2, from which we derive E(B − V) = 0.47 ± 0.13 (Güver & Özel 2009) and d = 3.0 ± 0.5 kpc.
Megier et al. (2009) studied the correlation of the interstellar Ca II doublet (H and K) with the distance to early-type stars beyond 1 kpc, taking into account the line saturation. J1727 appears to fulfil the conditions to apply this correlation [EW(K)/EW(H) > 1.3; and being no further than a few hundred parsecs from the Galactic plane]. This results in d = 3.2 ± 0.6 kpc.
We calculated the conditional probability resulting from the above methods. This results in E(B − V) = 0.57 ± 0.11, as well as d = 2.7 ± 0.3 kpc, and therefore, a height over the Galactic plane of z = 0.48 ± 0.05 kpc.
5. Conclusions
We present multi-epoch optical spectroscopy during the outburst of the newly discovered BHT J1727. We cover the main stages of the outburst, and report on the detection of diverse outflow features, including blue-shifted absorptions sometimes accompanied by red-shifted excesses (i.e. P Cygni profiles), broad emission wings, and flat-top profiles, in the H Balmer series. We also report the detection of similar features in the higher excitation He II-4686 Å line. The presence of red-shifted absorptions accompanied by blue emission wings in a number of epochs suggests the presence of inflows. Based on the current information available, we propose the following configuration for this system: a BHT with an early K-type companion, Porb ∼ 7.6 h, and placed at a distance of d = 2.7 ± 0.3 kpc (z = 0.48 ± 0.05 kpc over the Galactic plane).
Acknowledgments
D.M.S., T.M.D., and M.A.P. acknowledge support by the Spanish Ministry of Science via the Plan de Generacion de conocimiento: PID2020-120323GB-I00 and PID2021-124879NB-I00; as well as a Europa Excelencia grant (EUR2021-122010). We thank Tom Marsh for the use of MOLLY software. We are thankful to the GTC staff for their prompt and efficient response at triggering the time-of-opportunity program at the source of the spectroscopy presented in this Letter. Based on observations collected at the European Southern Observatory under ESO programme 105.20LK.002. This work has made use of data from the European Space Agency (ESA) mission Gaia (https://www.cosmos.esa.int/gaia), processed by the Gaia Data Processing and Analysis Consortium (DPAC, https://www.cosmos.esa.int/web/gaia/dpac/consortium). Funding for the DPAC has been provided by national institutions, in particular the institutions participating in the Gaia Multilateral Agreement. PYRAF is the python implementation of IRAF maintained by the community.
References
- Alabarta, K., Russell, D. M., Baglio, M. C., et al. 2023, ATel, 16232, 1 [NASA ADS] [Google Scholar]
- Baglio, M. C., Casella, P., Testa, V., et al. 2023, ATel, 16225, 1 [NASA ADS] [Google Scholar]
- Belloni, T., Homan, J., Casella, P., et al. 2005, A&A, 440, 207 [NASA ADS] [CrossRef] [EDP Sciences] [Google Scholar]
- Belloni, T. M., Motta, S. E., & Muñoz-Darias, T. 2011, Bull. Astron. Soc. India, 39, 409 [Google Scholar]
- Bollemeijer, N., Uttley, P., Buisson, D., et al. 2023a, ATel, 16247, 1 [NASA ADS] [Google Scholar]
- Bollemeijer, N., Uttley, P., Buisson, D., et al. 2023b, ATel, 16273, 1 [NASA ADS] [Google Scholar]
- Casares, J. 2018, MNRAS, 473, 5195 [CrossRef] [Google Scholar]
- Castro-Tirado, A. J., Sanchez-Ramirez, R., Caballero-Garcia, M. D., et al. 2023, ATel, 16208, 1 [NASA ADS] [Google Scholar]
- Cepa, J., Aguiar, M., Escalera, V. G., et al. 2000, in Optical and IR Telescope Instrumentation and Detectors, eds. M. Iye, & A. F. Moorwood, SPIE Conf. Ser., 4008, 623 [NASA ADS] [CrossRef] [Google Scholar]
- Chambers, K. C., Magnier, E. A., Metcalfe, N., et al. 2016, ArXiv e-prints [arXiv:1612.05560] [Google Scholar]
- Charles, P., Matthews, J. H., Buckley, D. A. H., et al. 2019, MNRAS, 489, L47 [Google Scholar]
- Cúneo, V. A., Muñoz-Darias, T., Sánchez-Sierras, J., et al. 2020, MNRAS, 498, 25 [CrossRef] [Google Scholar]
- Debnath, D., Nath, S. K., Chatterjee, D., et al. 2023, ATel, 16287, 1 [NASA ADS] [Google Scholar]
- Done, C., Gierliński, M., & Kubota, A. 2007, A&ARv, 15, 1 [Google Scholar]
- Draghis, P. A., Miller, J. M., Homan, J., et al. 2023, ATel, 16219, 1 [NASA ADS] [Google Scholar]
- Drilling, J. S., & Landolt, A. U. 2000, in Allen’s Astrophysical Quantities, ed. A. N. Cox, 381 [Google Scholar]
- Dubus, G., Kim, R. S. J., Menou, K., Szkody, P., & Bowen, D. V. 2001, ApJ, 553, 307 [NASA ADS] [CrossRef] [Google Scholar]
- Faulkner, J., Flannery, B. P., & Warner, B. 1972, ApJ, 175, L79 [NASA ADS] [CrossRef] [Google Scholar]
- Fender, R., & Belloni, T. 2012, Science, 337, 540 [NASA ADS] [CrossRef] [Google Scholar]
- Fitzpatrick, E. L. 2004, in Astrophysics of Dust, eds. A. N. Witt, G. C. Clayton, & B. T. Draine, ASP Conf. Ser., 309, 33 [NASA ADS] [Google Scholar]
- Gaia Collaboration (Prusti, T., et al.) 2016, A&A, 595, A1 [NASA ADS] [CrossRef] [EDP Sciences] [Google Scholar]
- Gaia Collaboration (Vallenari, A., et al.) 2023, A&A, 674, A1 [NASA ADS] [CrossRef] [EDP Sciences] [Google Scholar]
- Gandhi, P., Rao, A., Johnson, M. A. C., Paice, J. A., & Maccarone, T. J. 2019, MNRAS, 485, 2642 [Google Scholar]
- Güver, T., & Özel, F. 2009, MNRAS, 400, 2050 [Google Scholar]
- Homan, J., Wijnands, R., van der Klis, M., et al. 2001, ApJS, 132, 377 [NASA ADS] [CrossRef] [Google Scholar]
- Jiménez-Ibarra, F., Muñoz-Darias, T., Casares, J., Armas Padilla, M., & Corral-Santana, J. M. 2019, MNRAS, 489, 3420 [Google Scholar]
- Jordi, K., Grebel, E. K., & Ammon, K. 2006, A&A, 460, 339 [NASA ADS] [CrossRef] [EDP Sciences] [Google Scholar]
- Katoch, T., Antia, H. M., Nandi, A., & Shah, P. 2023a, ATel, 16235, 1 [NASA ADS] [Google Scholar]
- Katoch, T., Nandi, A., & Shah, P. 2023b, ATel, 16243, 1 [NASA ADS] [Google Scholar]
- Lipunov, V., Kornilov, V., Gorbovskoy, E., et al. 2023, GRB Coordinates Network, 34536, 1 [NASA ADS] [Google Scholar]
- López, K. M., Jonker, P. G., Torres, M. A. P., et al. 2019, MNRAS, 482, 2149 [CrossRef] [Google Scholar]
- Mata Sanchez, D., & Muñoz-Darias, T. 2023, ATel, 16216, 1 [NASA ADS] [Google Scholar]
- Mata Sánchez, D., Muñoz-Darias, T., Casares, J., et al. 2018, MNRAS, 481, 2646 [Google Scholar]
- Mata Sánchez, D., Muñoz-Darias, T., Cúneo, V. A., et al. 2022, ApJ, 926, L10 [CrossRef] [Google Scholar]
- Mata Sánchez, D., Muñoz-Darias, T., Casares, J., Huertas-Company, M., & Panizo-Espinar, G. 2023, MNRAS, 524, 338 [CrossRef] [Google Scholar]
- Megier, A., Strobel, A., Galazutdinov, G. A., & Krełowski, J. 2009, A&A, 507, 833 [NASA ADS] [CrossRef] [EDP Sciences] [Google Scholar]
- Mereminskiy, I., Lutovinov, A., Molkov, S., et al. 2023, MNRAS, submitted, [arXiv:2310.06697] [Google Scholar]
- Miller-Jones, J. C. A., Bahramian, A., Altamirano, D., et al. 2023a, ATel, 16271, 1 [NASA ADS] [Google Scholar]
- Miller-Jones, J. C. A., Sivakoff, G. R., Bahramian, A., & Russell, T. D. 2023b, ATel, 16211, 1 [NASA ADS] [Google Scholar]
- Munari, U., & Zwitter, T. 1997, A&A, 318, 269 [NASA ADS] [Google Scholar]
- Muñoz-Darias, T., & Ponti, G. 2022, A&A, 664, A104 [NASA ADS] [CrossRef] [EDP Sciences] [Google Scholar]
- Muñoz-Darias, T., Fender, R. P., Motta, S. E., & Belloni, T. M. 2014, MNRAS, 443, 3270 [CrossRef] [Google Scholar]
- Muñoz-Darias, T., Casares, J., Mata Sánchez, D., et al. 2016, Nature, 534, 75 [Google Scholar]
- Muñoz-Darias, T., Jiménez-Ibarra, F., Panizo-Espinar, G., et al. 2019, ApJ, 879, L4 [CrossRef] [Google Scholar]
- Nakajima, M., Negoro, H., Serino, M., et al. 2023, ATel, 16206, 1 [NASA ADS] [Google Scholar]
- Negoro, H., Serino, M., Nakajima, M., et al. 2023, ATel, 16205, 1 [NASA ADS] [Google Scholar]
- O’Connor, B., Hare, J., Younes, G., et al. 2023, ATel, 16207, 1 [Google Scholar]
- Page, K. L., Dichiara, S., Gropp, J. D., et al. 2023, GRB Coordinates Network, 34537, 1 [NASA ADS] [Google Scholar]
- Palmer, D. M., & Parsotan, T. M. 2023, ATel, 16215, 1 [NASA ADS] [Google Scholar]
- Panizo-Espinar, G., Armas Padilla, M., Muñoz-Darias, T., et al. 2022, A&A, 664, A100 [NASA ADS] [CrossRef] [EDP Sciences] [Google Scholar]
- Parra, M., Petrucci, P.-O., Bianchi, S., et al. 2024, A&A, 681, A49 [NASA ADS] [CrossRef] [EDP Sciences] [Google Scholar]
- Ponti, G., Fender, R. P., Begelman, M. C., et al. 2012, MNRAS, 422, L11 [NASA ADS] [CrossRef] [Google Scholar]
- Sánchez-Sierras, J., & Muñoz-Darias, T. 2020, A&A, 640, L3 [EDP Sciences] [Google Scholar]
- Sánchez-Sierras, J., Muñoz-Darias, T., Motta, S. E., et al. 2023, A&A, 680, L16 [NASA ADS] [CrossRef] [EDP Sciences] [Google Scholar]
- Savage, B. D., & Mathis, J. S. 1979, ARA&A, 17, 73 [NASA ADS] [CrossRef] [Google Scholar]
- Schlafly, E. F., & Finkbeiner, D. P. 2011, ApJ, 737, 103 [Google Scholar]
- Shahbaz, T., & Kuulkers, E. 1998, MNRAS, 295, L1 [NASA ADS] [Google Scholar]
- Soria, R., Wu, K., & Hunstead, R. W. 2000, ApJ, 539, 445 [NASA ADS] [CrossRef] [Google Scholar]
- Tonry, J. L., Stubbs, C. W., Lykke, K. R., et al. 2012, ApJ, 750, 99 [Google Scholar]
- Trushkin, S. A., Bursov, N. N., Nizhelskij, N. A., & Tsybulev, P. G. 2023, ATel, 16289, 1 [NASA ADS] [Google Scholar]
- Wallerstein, G., Sandstrom, K., & Gredel, R. 2007, PASP, 119, 1268 [NASA ADS] [CrossRef] [Google Scholar]
- Wang, Y. D., & Bellm, E. C. 2023, ATel, 16209, 1 [NASA ADS] [Google Scholar]
Appendix A: Compilation of possible outflow features
Compilation of possible outflow features.
All Tables
All Figures
|
Fig. 1. HID constructed from MAXI data. Hardness corresponds to the ratio of the count rates in the 4–10 keV to the 2–4 keV bands, while the intensity corresponds to the count rate in the 2–20 keV band. The black line depicts the outburst evolution with the grey square representing a binning of ∼50 days of data prior to the X-ray trigger (shown as transparent points in the background). The stars mark the timestamps of our optical observations, coloured according to the X-ray state (see Table 1): hard state (blue), HIMS (green), SIMS (orange), and soft state (red). |
| In the text | |
|
Fig. 2. Normalised spectrum of five relevant spectroscopic epochs. They are offset vertically by 0.25 (0.3 in the right panel) for visualisation purposes; the colours correspond to their X-ray state, as defined in Fig. 1. The identified transitions in this wavelength range are marked with dotted lines: black for H, red for He I, blue for He II, and green for other metallic lines (Bowen blend at ∼ 4640 Å). Telluric bands and interstellar features are shown as grey and yellow shadowed regions, respectively. The E20 spectrum was smoothed through convolution with a Gaussian for visualisation purposes. |
| In the text | |
|
Fig. 3. Normalised spectrum of epochs E7 (green) and E11 (blue). They are representatives of the blue-shifted and red-shifted absorption features detected during the outburst. The identified transitions in this wavelength range are marked with black dashed lines (in the laboratory rest frame), while the velocities of ±900 km s−1 and ±1150 km s−1 (referred to the rest wavelength of each line after accounting for the systemic velocity) are marked with red and blue dashed lines, respectively. Telluric bands and interstellar features are shown as grey and yellow shadowed regions, respectively. |
| In the text | |
|
Fig. 4. Pre-outburst quiescent counterpart of J1727 from PS1 r-band images. The position of the quiescent counterpart is marked with a white cross. |
| In the text | |
Current usage metrics show cumulative count of Article Views (full-text article views including HTML views, PDF and ePub downloads, according to the available data) and Abstracts Views on Vision4Press platform.
Data correspond to usage on the plateform after 2015. The current usage metrics is available 48-96 hours after online publication and is updated daily on week days.
Initial download of the metrics may take a while.