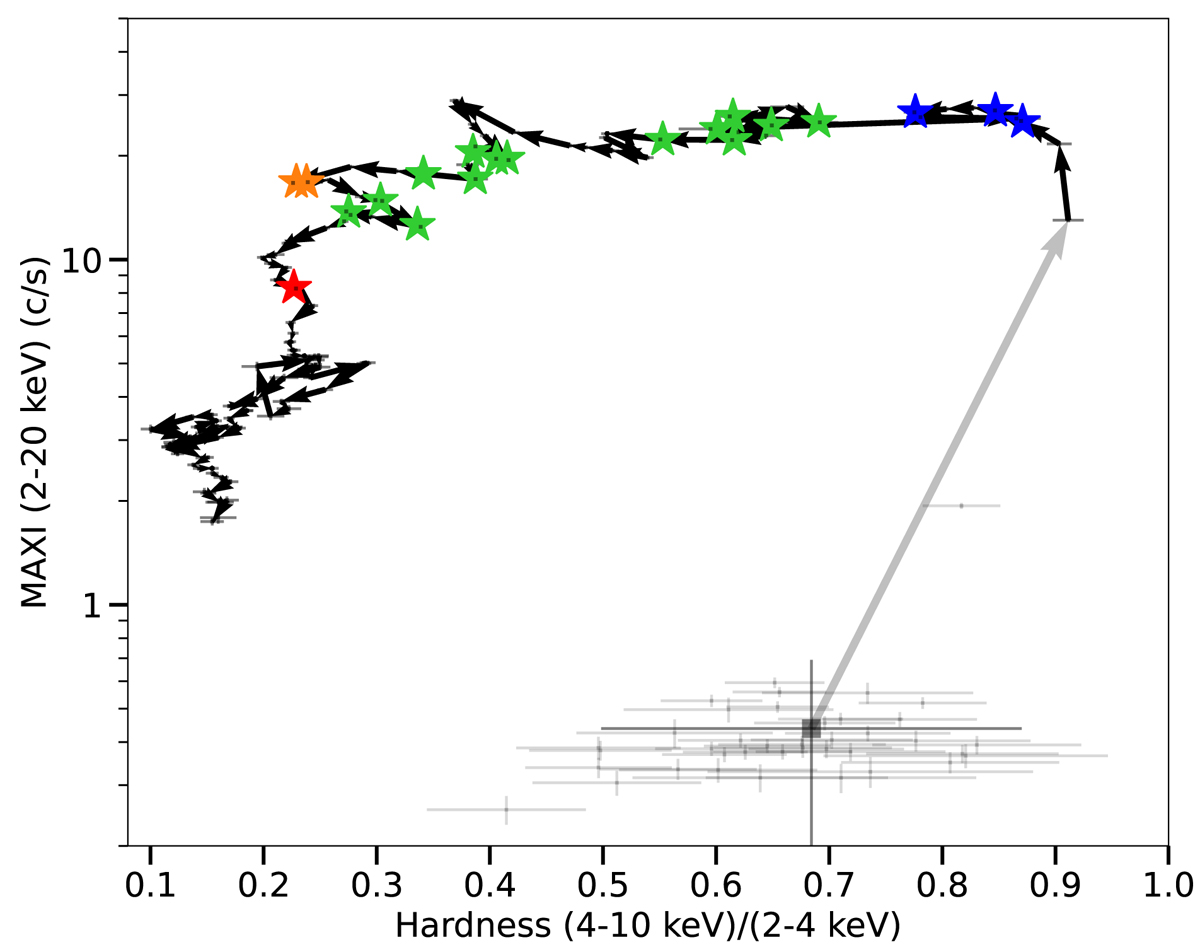
Fig. 1.
Download original image
HID constructed from MAXI data. Hardness corresponds to the ratio of the count rates in the 4–10 keV to the 2–4 keV bands, while the intensity corresponds to the count rate in the 2–20 keV band. The black line depicts the outburst evolution with the grey square representing a binning of ∼50 days of data prior to the X-ray trigger (shown as transparent points in the background). The stars mark the timestamps of our optical observations, coloured according to the X-ray state (see Table 1): hard state (blue), HIMS (green), SIMS (orange), and soft state (red).
Current usage metrics show cumulative count of Article Views (full-text article views including HTML views, PDF and ePub downloads, according to the available data) and Abstracts Views on Vision4Press platform.
Data correspond to usage on the plateform after 2015. The current usage metrics is available 48-96 hours after online publication and is updated daily on week days.
Initial download of the metrics may take a while.