Fig. 2.
Download original image
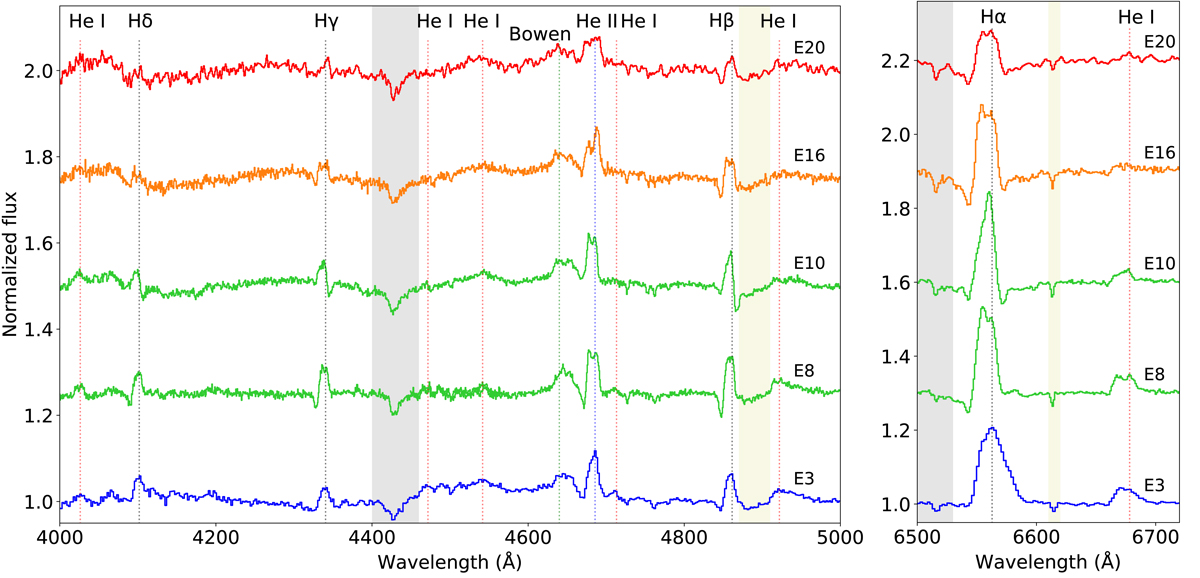
Normalised spectrum of five relevant spectroscopic epochs. They are offset vertically by 0.25 (0.3 in the right panel) for visualisation purposes; the colours correspond to their X-ray state, as defined in Fig. 1. The identified transitions in this wavelength range are marked with dotted lines: black for H, red for He I, blue for He II, and green for other metallic lines (Bowen blend at ∼ 4640 Å). Telluric bands and interstellar features are shown as grey and yellow shadowed regions, respectively. The E20 spectrum was smoothed through convolution with a Gaussian for visualisation purposes.
Current usage metrics show cumulative count of Article Views (full-text article views including HTML views, PDF and ePub downloads, according to the available data) and Abstracts Views on Vision4Press platform.
Data correspond to usage on the plateform after 2015. The current usage metrics is available 48-96 hours after online publication and is updated daily on week days.
Initial download of the metrics may take a while.