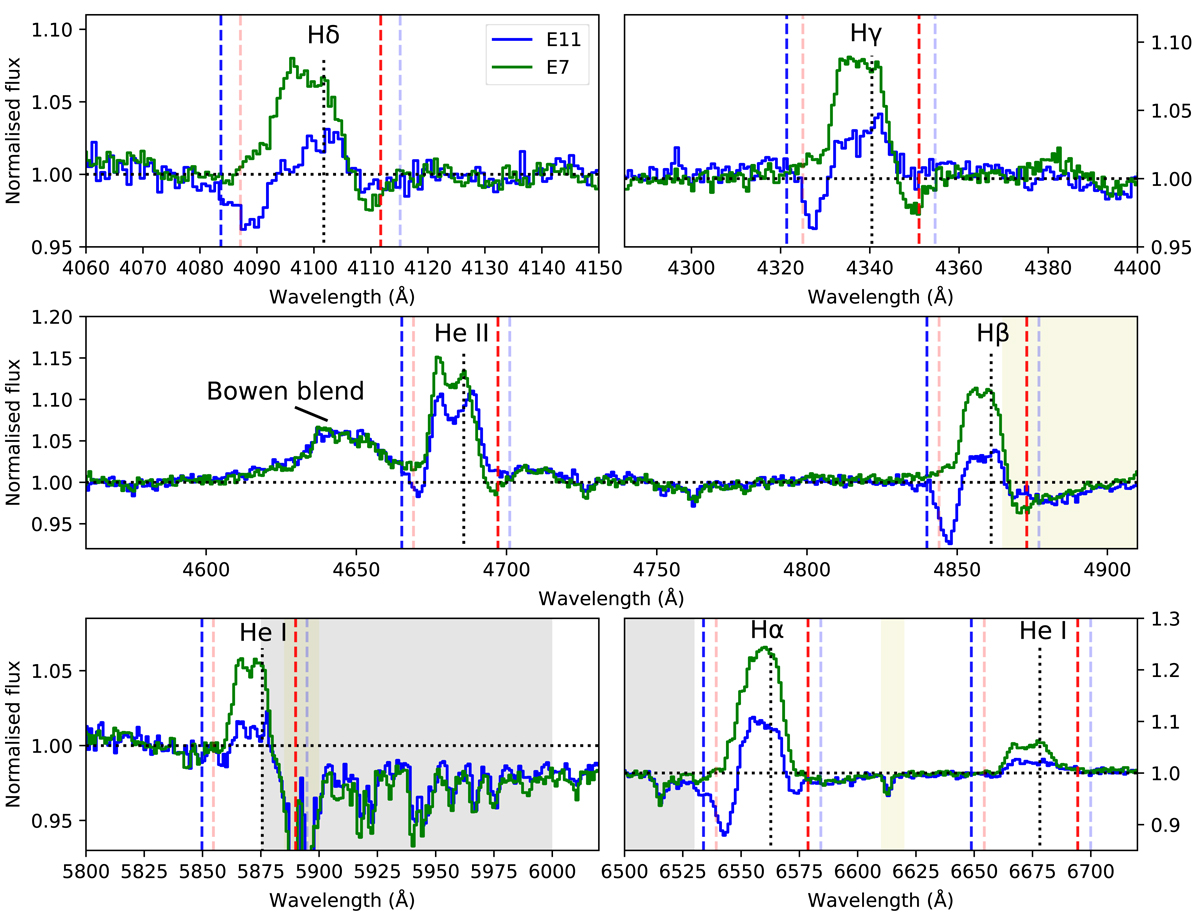
Fig. 3.
Download original image
Normalised spectrum of epochs E7 (green) and E11 (blue). They are representatives of the blue-shifted and red-shifted absorption features detected during the outburst. The identified transitions in this wavelength range are marked with black dashed lines (in the laboratory rest frame), while the velocities of ±900 km s−1 and ±1150 km s−1 (referred to the rest wavelength of each line after accounting for the systemic velocity) are marked with red and blue dashed lines, respectively. Telluric bands and interstellar features are shown as grey and yellow shadowed regions, respectively.
Current usage metrics show cumulative count of Article Views (full-text article views including HTML views, PDF and ePub downloads, according to the available data) and Abstracts Views on Vision4Press platform.
Data correspond to usage on the plateform after 2015. The current usage metrics is available 48-96 hours after online publication and is updated daily on week days.
Initial download of the metrics may take a while.