Fig. A.2
Download original image
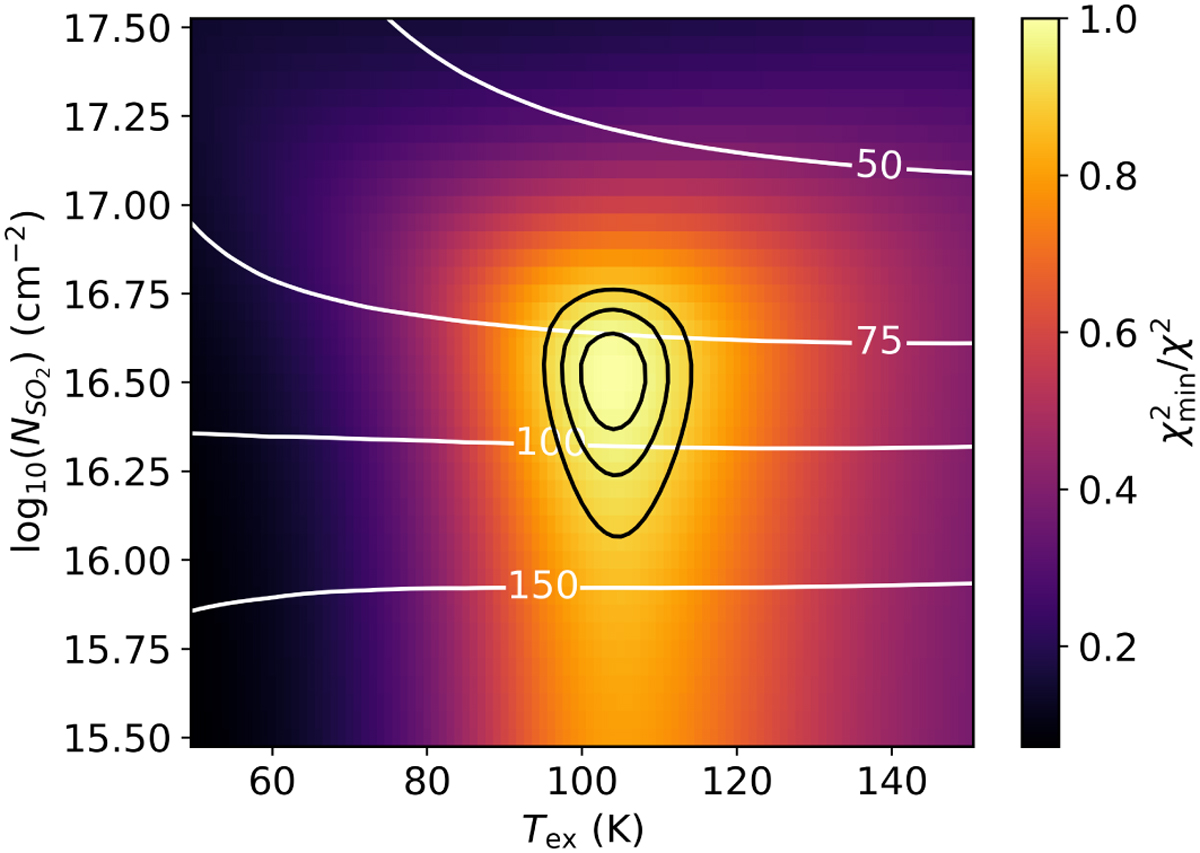
χ2 map for SO2 derived from pure rotational lines in the ALMA data. The χ2 values are inversely normalized by the minimum χ2 and shown in color. The 1, 2, and 3σ confidence intervals are presented as the black contours. The best-fitting emitting radius, R (in au), is represented by the white contours and is calculated for each grid point by minimizing the χ2 assuming a circular emitting area of πR2. The χ2 map indicates that the SO2 emission has an excitation temperature of 104 ± 5 K and is marginally optically thick (τ ~ 0.1) with an emitting area of ~ 85 au in radius.
Current usage metrics show cumulative count of Article Views (full-text article views including HTML views, PDF and ePub downloads, according to the available data) and Abstracts Views on Vision4Press platform.
Data correspond to usage on the plateform after 2015. The current usage metrics is available 48-96 hours after online publication and is updated daily on week days.
Initial download of the metrics may take a while.