Fig. 9.
Download original image
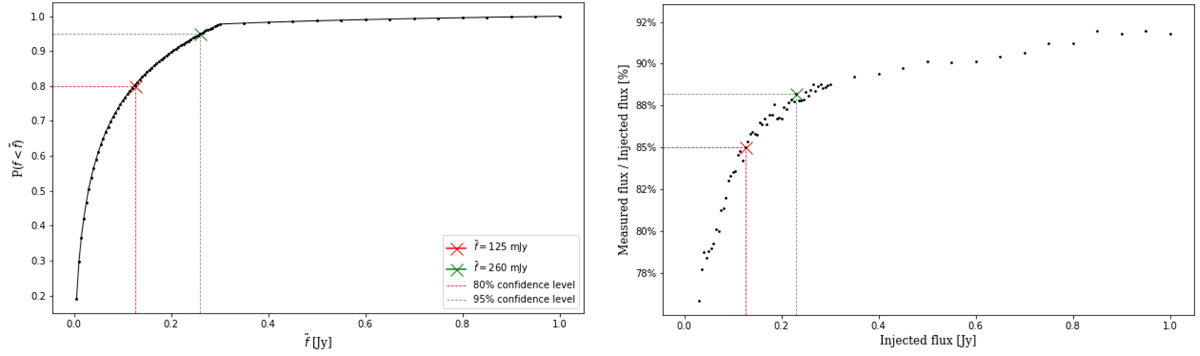
Cumulative distribution function and recovered flux percentage in the injection procedure for A21-G114.9. Left panel: cumulative distribution function of R(f), normalised to unit area over the interval 5 mJy ≤ f ≤ 1 Jy. The horizontal grey line marks the 95% probability that the bridge in A21-G114.9 has a flux density lower than ![]() mJy (green cross), since it is not detected in our observations. This sets an upper limit on its flux density at
mJy (green cross), since it is not detected in our observations. This sets an upper limit on its flux density at ![]() with a 95% confidence level. With a second criterion based on the extension and continuity of the bridge emission (see Sect. 4.1), we find a lower value for the upper limit at
with a 95% confidence level. With a second criterion based on the extension and continuity of the bridge emission (see Sect. 4.1), we find a lower value for the upper limit at ![]() mJy. From the cumulative function, there is an 80% probability that the bridge emission is lower than 125 mJy (red cross). Right panel: plot of the ratio (as a percentage) between the measured flux density and the injected flux density, with a varying injected flux density. The green cross corresponds to the recovered percentage of the 260 mJy injected bridge emission (∼88%), and the red cross corresponds to the recovered percentage of the 125 mJy injected bridge emission (85%). We notice that the fractional recovered flux increases at increasing injected flux density, converging around ∼92%. The injected flux density lost in this procedure is never higher than ∼23%.
mJy. From the cumulative function, there is an 80% probability that the bridge emission is lower than 125 mJy (red cross). Right panel: plot of the ratio (as a percentage) between the measured flux density and the injected flux density, with a varying injected flux density. The green cross corresponds to the recovered percentage of the 260 mJy injected bridge emission (∼88%), and the red cross corresponds to the recovered percentage of the 125 mJy injected bridge emission (85%). We notice that the fractional recovered flux increases at increasing injected flux density, converging around ∼92%. The injected flux density lost in this procedure is never higher than ∼23%.
Current usage metrics show cumulative count of Article Views (full-text article views including HTML views, PDF and ePub downloads, according to the available data) and Abstracts Views on Vision4Press platform.
Data correspond to usage on the plateform after 2015. The current usage metrics is available 48-96 hours after online publication and is updated daily on week days.
Initial download of the metrics may take a while.