Fig. 8.
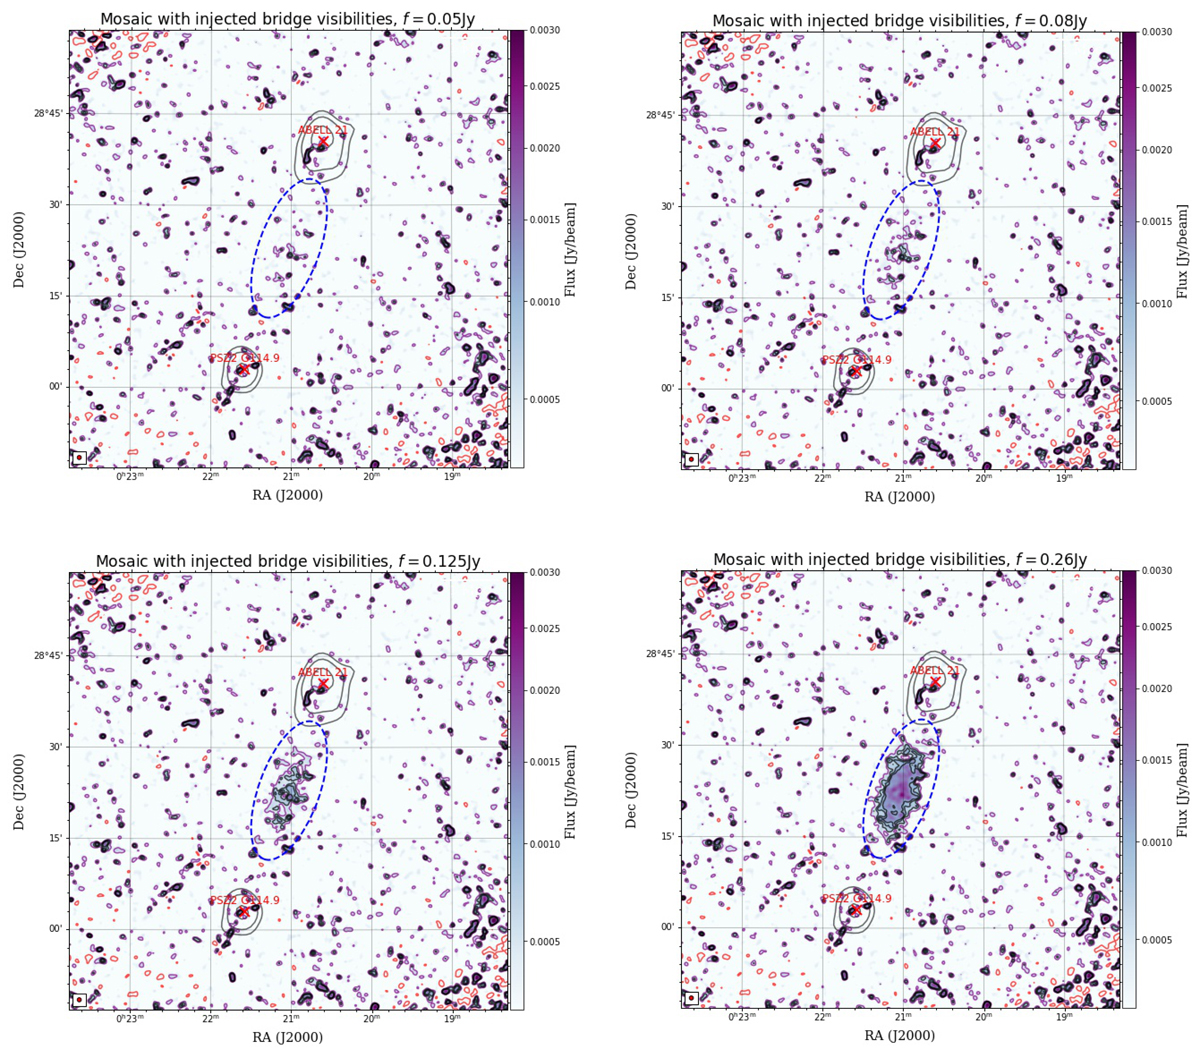
Download original image
Examples of 383 MHz uGMRT images of A21-G114.9 where the bridge visibilities are injected, as a function-integrated flux density, f. X-ray ROSAT contours are shown in yellow and the location of the X-ray peak is marked with yellow crosses. In particular, we show the different contribution of the injected bridge emission when increasing its flux density, from f = 50 mJy to f = 260 mJy. The visibilities are injected inside a 2D model Gaussian (dashed blue ellipse) with a semi-major axis of 12′ (∼2.5 Mpc) and a semi-minor axis of 5′ (∼500 kpc). We note how in the first two top panels the bridge emission is not significantly detected, while approaching the two values found for the upper limit on the flux density (bottom panels) the emission is continuous and detected over 2σrms. Contour levels are drawn from 2σrms (in purple) to 5σrms (in black). A negative contour level at −3σrms is shown in red.
Current usage metrics show cumulative count of Article Views (full-text article views including HTML views, PDF and ePub downloads, according to the available data) and Abstracts Views on Vision4Press platform.
Data correspond to usage on the plateform after 2015. The current usage metrics is available 48-96 hours after online publication and is updated daily on week days.
Initial download of the metrics may take a while.