Fig. 6.
Download original image
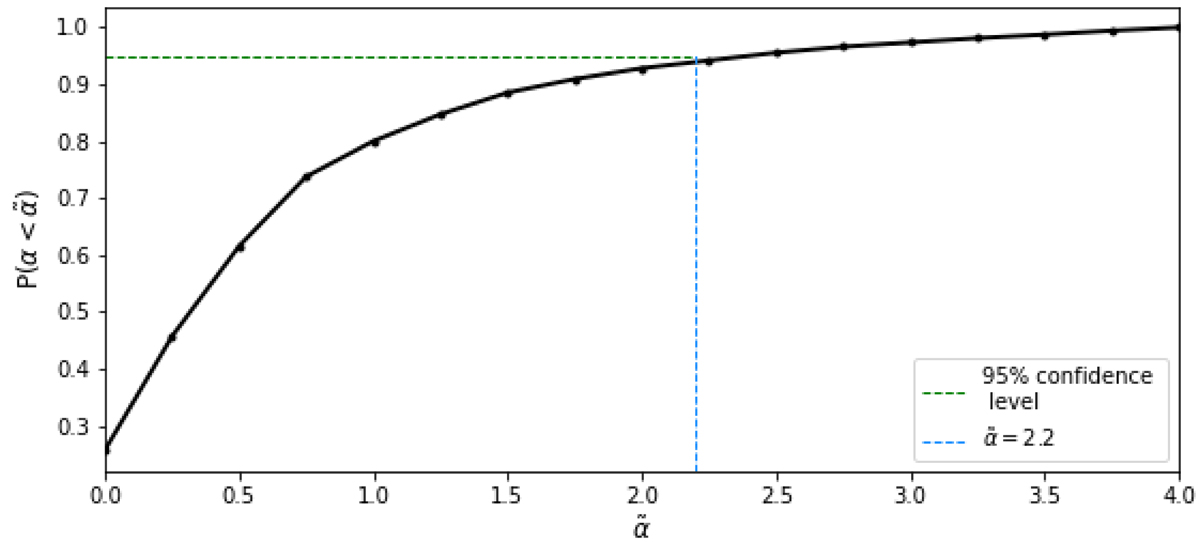
Cumulative distribution function of R(α), normalised to unit area over the interval 0 ≤ α ≤ 4. The horizontal green line marks the 95% probability that the spectral index of the bridge in A399-A401 takes on a value smaller than α ∼ 2.2 (vertical blue line) if the bridge were detected in our uGMRT observations. The non-detection sets a lower limit for the spectral index at αl > 2.2 with a 95% confidence level.
Current usage metrics show cumulative count of Article Views (full-text article views including HTML views, PDF and ePub downloads, according to the available data) and Abstracts Views on Vision4Press platform.
Data correspond to usage on the plateform after 2015. The current usage metrics is available 48-96 hours after online publication and is updated daily on week days.
Initial download of the metrics may take a while.