Fig. 3.
Download original image
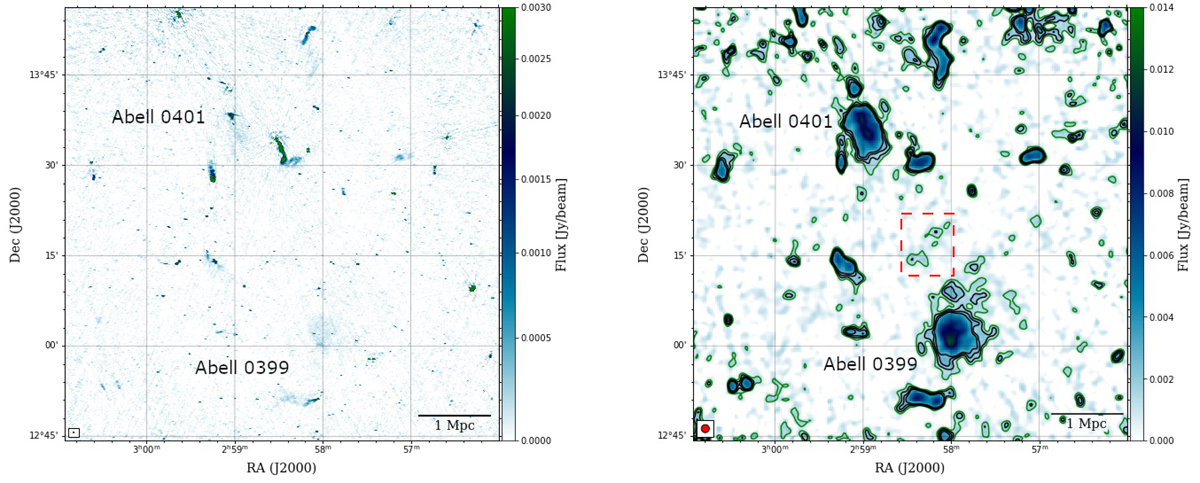
Mosaic radio images at 400 MHz of the A399-A401 cluster pair. Left panel: high-resolution (12″ × 5″) mosaic image with σrms = 50 μJy beam−1 produced with Briggs robust = 0 and primary-beam-corrected. A hint of diffuse emission from the radio halos is visible, but no emission is detected in the bridge area. Right panel: low-resolution (80″ × 80″), compact source-subtracted image with σrms = 600 μJy beam−1. It is generated by Briggs robust=-0.5 and a Gaussian uv-taper of 60″. Contour levels start at 2σrms (in green) and increase up to 5σrms (black). The red-dashed box denotes the region where we find a 2σrms detection of a patch of the bridge. The red arrow points to the extension of the A399 radio halo, discussed in Sect. 3.3.
Current usage metrics show cumulative count of Article Views (full-text article views including HTML views, PDF and ePub downloads, according to the available data) and Abstracts Views on Vision4Press platform.
Data correspond to usage on the plateform after 2015. The current usage metrics is available 48-96 hours after online publication and is updated daily on week days.
Initial download of the metrics may take a while.