Fig. 2
Download original image
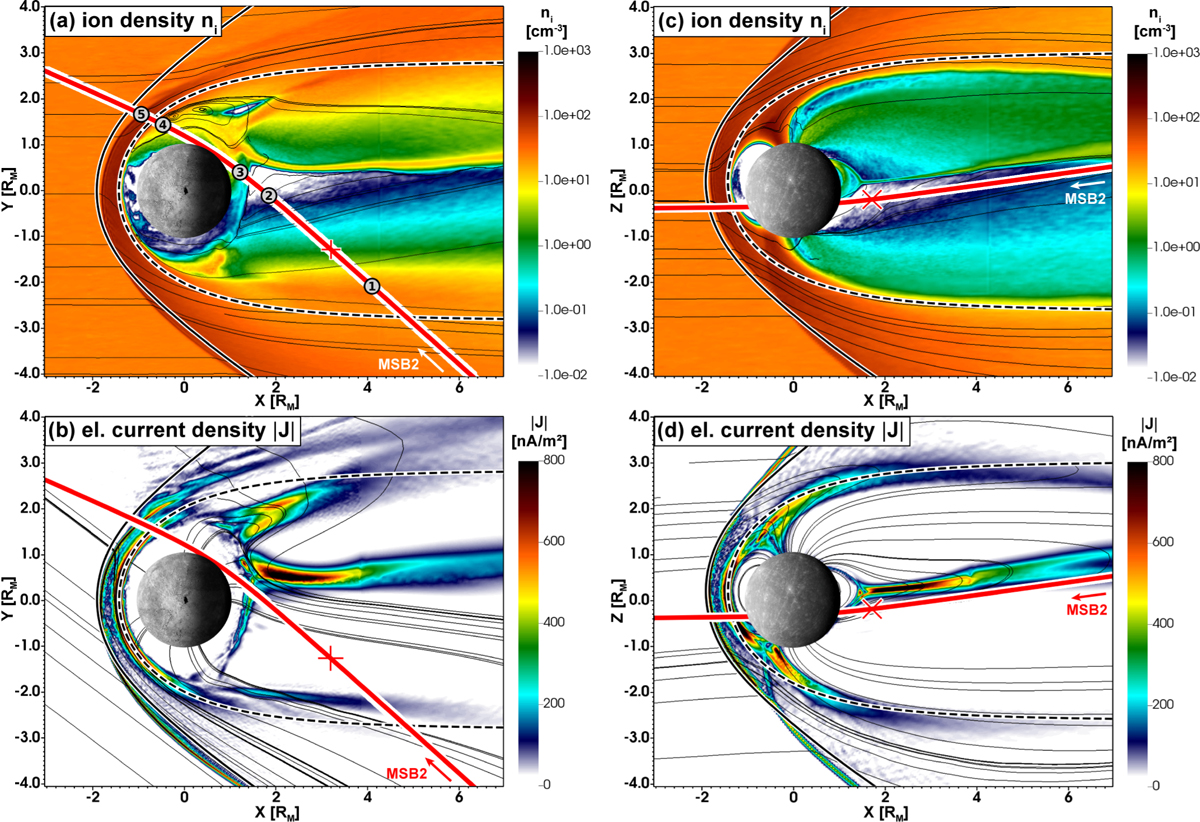
AIKEF MSB2 simulation overview. Panels a and b show modeled plasma density ni and electric current density |J| in the XY (equatorial) plane (MASO). Panels c and d illustrate the same parameters but in the XZ (meridonial) plane. The black thin lines in panels a and c represent the bulk flow velocity, whereas the black thin lines in b and d indicate magnetic field lines. The red thick lines with a white outline correspond to the projected MSB2 trajectory, with crosses indicating the points where the simulation “slice” is intersected. The models for magnetopause and bow shock are illustrated by the black dashed (Winslow et al. 2013) and black solid (Slavin et al. 2009; Winslow et al. 2013) lines.
Current usage metrics show cumulative count of Article Views (full-text article views including HTML views, PDF and ePub downloads, according to the available data) and Abstracts Views on Vision4Press platform.
Data correspond to usage on the plateform after 2015. The current usage metrics is available 48-96 hours after online publication and is updated daily on week days.
Initial download of the metrics may take a while.