Fig. 1
Download original image
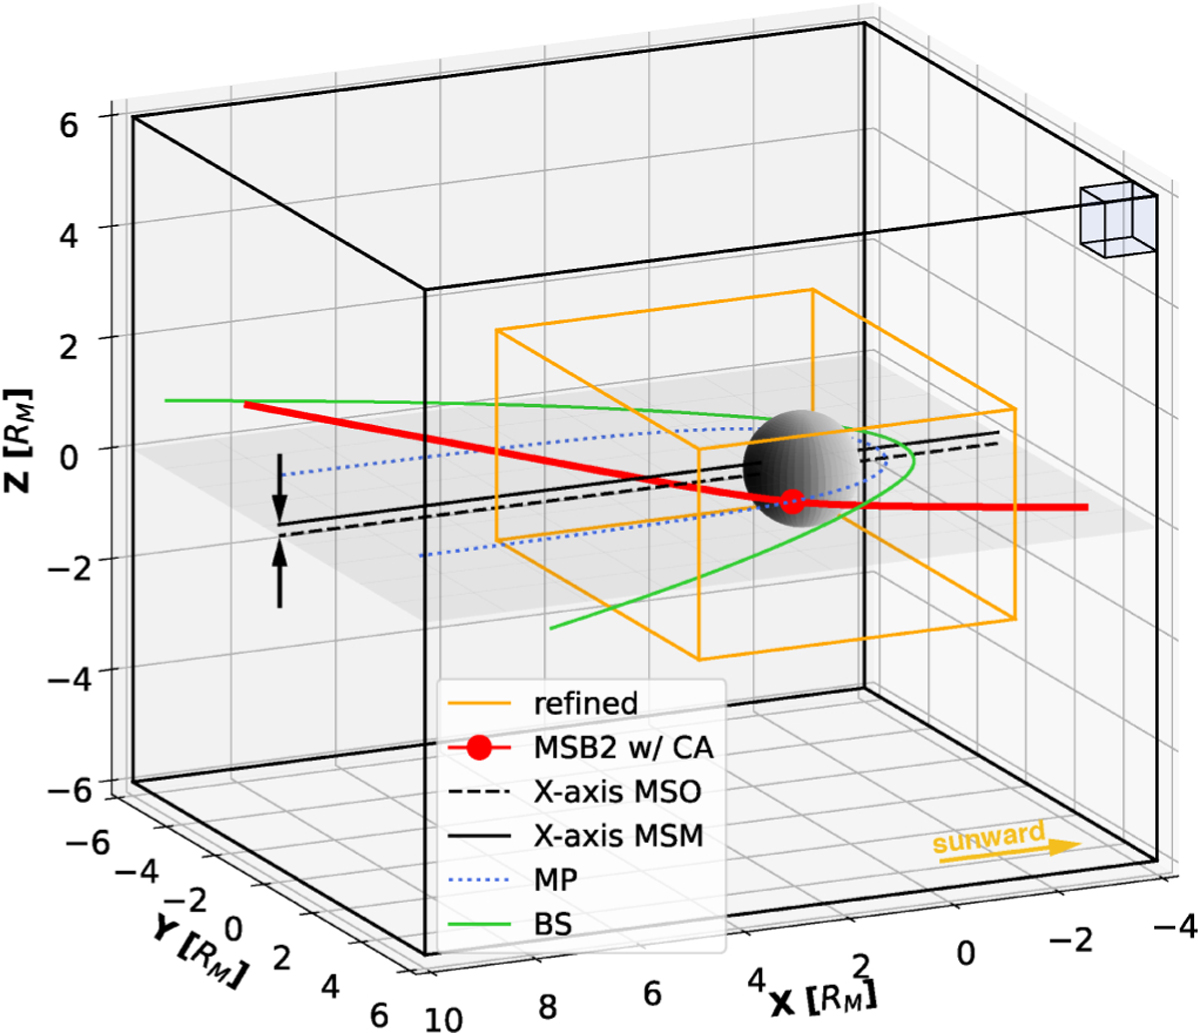
Overview of the AIKEF simulation box. In the top-right corner, there is an exemplary unrefined block that is further divided into cells that define the grid resolution (size ratios: block to simulation box = cell to block). The black arrows denote the difference between the MASO and MSM coordinate system, which is shifted 0.2RM in the +Z direction. The subsolar point is defined to be on the MSM X-axis; see modelled bow shock (green, solid line) and magnetopause (blue, dotted). The MSB2 trajectory with its closest approach is shown in red; the orange outline encloses the refined area (grid resolution doubled).
Current usage metrics show cumulative count of Article Views (full-text article views including HTML views, PDF and ePub downloads, according to the available data) and Abstracts Views on Vision4Press platform.
Data correspond to usage on the plateform after 2015. The current usage metrics is available 48-96 hours after online publication and is updated daily on week days.
Initial download of the metrics may take a while.