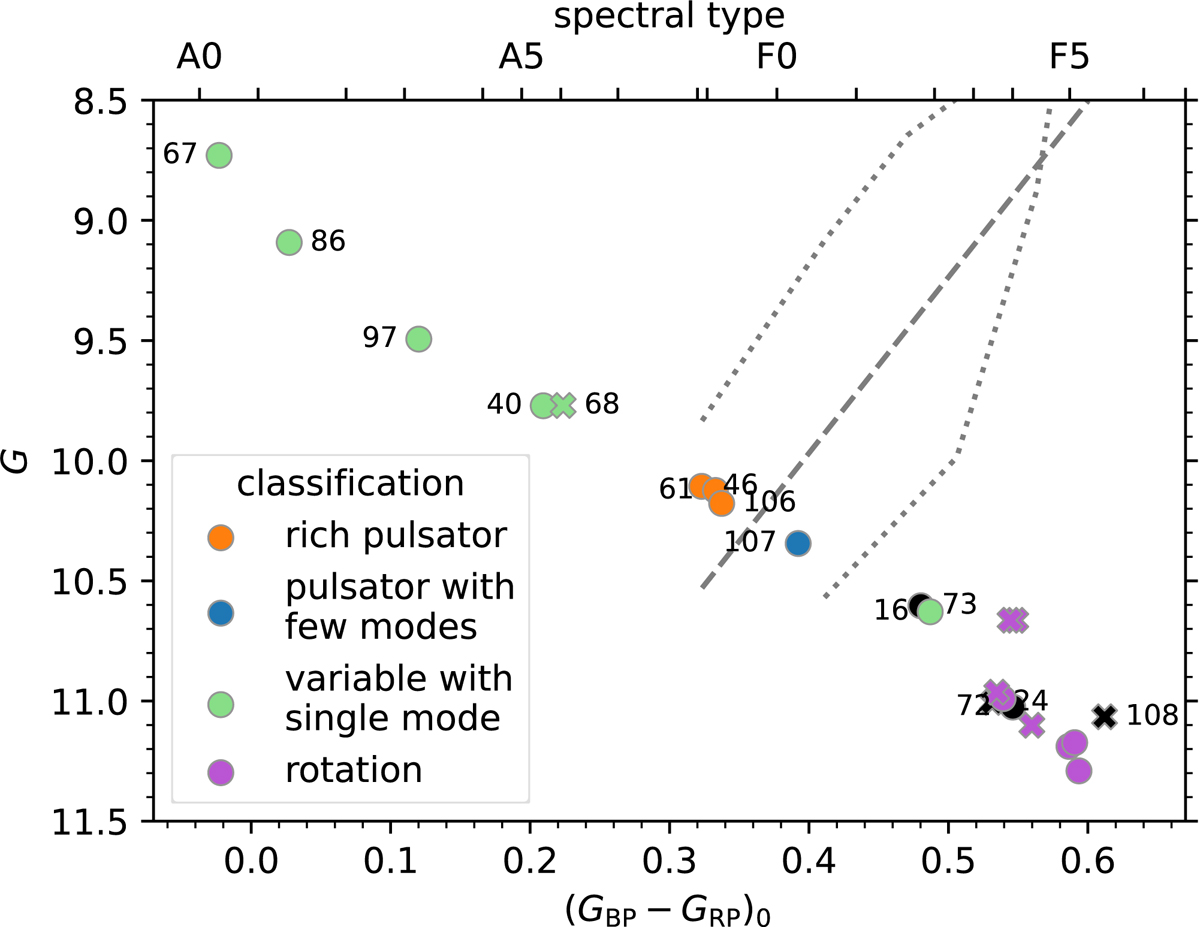
Fig. 6.
Download original image
Colour-magnitude diagram of UBC 1 with the intermediate-mass members colour-coded by their number of detected signals. The three rich pulsators are shown in orange. In blue, we show the pulsator with only a handful of independent frequencies in their periodogram, while stars in green have either a single frequency or noisy Fourier spectra and can therefore not be identified as pulsators unambiguously. For stars with (GBP − GRP)0 > 0.5, rotational modulation (purple) is the only source of variability. Black symbols indicate stars without a light curve. Stars shown as crosses are potential binaries. The dotted lines indicate the approximate edges of the γ Dor instability strip from Dupret et al. (2005) and the dashed line denotes the red edge of the empirical δ Sct instability strip from Murphy et al. (2019). Details on individual stars (labelled with their ID number) can be found in the text.
Current usage metrics show cumulative count of Article Views (full-text article views including HTML views, PDF and ePub downloads, according to the available data) and Abstracts Views on Vision4Press platform.
Data correspond to usage on the plateform after 2015. The current usage metrics is available 48-96 hours after online publication and is updated daily on week days.
Initial download of the metrics may take a while.