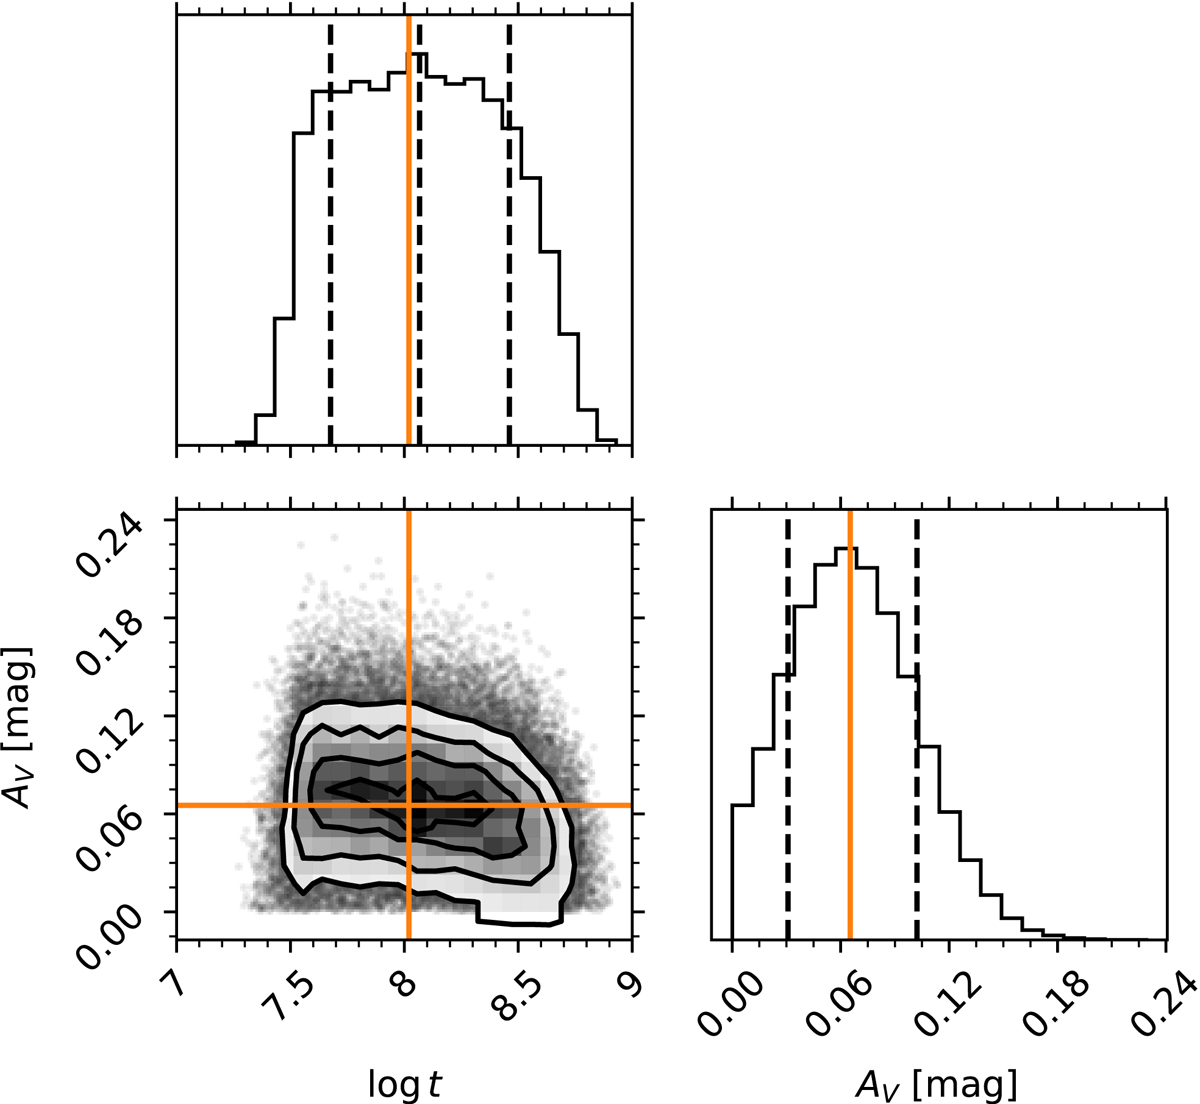
Fig. 3.
Download original image
Corner plot of the posterior distributions from the MCMC isochrone fitting of UBC 1 with the rotating MIST models at v/vcrit = 0.5. The orange lines indicates the maximum likelihood values and the dashed marks show the 16th, 50th (median), and 86th percentiles as an uncertainty estimate. For the extinction the median and the maximum likelihood coincide.
Current usage metrics show cumulative count of Article Views (full-text article views including HTML views, PDF and ePub downloads, according to the available data) and Abstracts Views on Vision4Press platform.
Data correspond to usage on the plateform after 2015. The current usage metrics is available 48-96 hours after online publication and is updated daily on week days.
Initial download of the metrics may take a while.